Equity Research Analysis: Zeta Global Holdings Corp. (ZETA)
|Blank Capital Research Unit|Spot: $17.39
Price$17.39
Composite Score43.6/100
RatingREDUCE (2★)
Rank#3043 OF 7,333
Market Cap$9.4B
IMPORTANT DISCLAIMER: Blank Capital Research ("BCR") is a technology platform, not a registered investment advisor or broker-dealer. The algorithmically generated signals, scores, and rankings provided on this site ("God Mode" Signals) are for informational and research purposes only and do not constitute financial advice, investment recommendations, or an offer to sell or solicit an offer to buy any securities.
HYPOTHETICAL PERFORMANCE RESULTS: The "timing scores" and "regime signals" displayed are based on quantitative models. Hypothetical or simulated performance results have certain inherent limitations. Unlike an actual performance record, simulated results do not represent actual trading. Also, since the trades have not actually been executed, the results may have under-or-over compensated for the impact, if any, of certain market factors, such as lack of liquidity.
RISK OF LOSS: Trading in financial markets involves a high degree of risk and may result in the loss of your entire investment. Data provided by third-party sources (Intrinio, Snowflake) is believed to be reliable but is not guaranteed for accuracy or completeness. Past performance is not indicative of future results.
© 2026 Blank Capital Research. All rights reserved. System Version: Aegis V8 (God Mode).
Verdict
Quantitative factor alignment verified for current market regime.
Quant Score
Rank
#3043
Positioning
Market Dominance
Services
Computer Software
$9.4B
David A. Steinberg
Zeta Global Holdings Corp. operates an omnichannel data-driven cloud platform that provides enterprises with consumer intelligence and marketing automation software. Zeta Marketing Platform analyzes billions of structured and unstructured data points to predict consumer intent. Consumer Data platform ingests, analyzes, and distills disparate data points.
Get full access to institutional-quality research tools with Blank Capital Pro.
Upgrade to ProStarting at $19.99/mo
Get full access to institutional-quality research tools with Blank Capital Pro.
Upgrade to ProStarting at $19.99/mo
Get full access to institutional-quality research tools with Blank Capital Pro.
Upgrade to ProStarting at $19.99/mo
Get full access to institutional-quality research tools with Blank Capital Pro.
Upgrade to ProStarting at $19.99/mo
Get full access to institutional-quality research tools with Blank Capital Pro.
Upgrade to ProStarting at $19.99/mo
X-AXIS: EV/EBITDA (LOWER = CHEAPER) | Y-AXIS: ROE (HIGHER = ELITE) | RED CIRCLE = ZETA ANALYSIS TARGET
| Stock | Rating | Score▼ | Quality | Value | Momentum | P/E | EV/EBITDA | ROE | ROA | Gross Mgn | Op Mgn | Net Mgn | Rev Growth | Div Yield | D/E | Mkt Cap | AUDIT |
|---|---|---|---|---|---|---|---|---|---|---|---|---|---|---|---|---|---|
$YALA Yalla Group Ltd | 75 | 89 | 99 | 80 | - | - | - | - | - | - | - | - | - | - | $0 | VS | |
$GRVY GRAVITY Co., Ltd. | 75 | 82 | 96 | 71 | - | - | - | - | - | - | - | - | - | - | $0 | VS | |
$ISSC INNOVATIVE SOLUTIONS & SUPPORT INC | 73 | 81 | 88 | 94 | 25.0x | 14.1x | 17.1% | 10.3% | 35.5% | 14.6% | 10.1% | 105.2% | 0.0% | 41.0x | $244M | VS | |
$AER AerCap Holdings N.V. | 72 | 60 | 87 | 84 | - | - | - | - | - | - | - | - | - | - | $0 | VS | |
$HCSG HEALTHCARE SERVICES GROUP INC | 72 | 74 | 88 | 88 | 7.1x | 6.1x | 28.9% | 20.8% | 20.8% | 9.9% | 9.3% | 8.5% | 0.0% | 1.0x | $1.2B | VS | |
$LQDT LIQUIDITY SERVICES INC | 72 | 90 | 88 | 68 | 24.9x | 14.3x | 14.1% | 8.3% | 45.7% | 8.5% | 6.2% | 28.1% | 0.0% | 0.0x | $736M | VS | |
$TRTNpA Triton International Ltd | 71 | 70 | 89 | 70 | - | 1.7x | 0.0% | - | 97.4% | 58.0% | 37.4% | - | 8.8% | 264.0x | $2.5B | VS | |
$EDU New Oriental Education & Technology Group Inc. | 71 | 83 | 52 | 77 | - | - | - | - | - | - | - | - | - | - | $0 | VS | |
$NTES NetEase, Inc. | 71 | 88 | 93 | 68 | - | - | - | - | - | - | - | - | - | - | $0 | VS | |
$UTI UNIVERSAL TECHNICAL INSTITUTE INC | 70 | 86 | 86 | 72 | 43.2x | 16.0x | 15.3% | 5.8% | 100.0% | 6.9% | 5.2% | 15.1% | 0.0% | 24.0x | $1.8B | VS | |
$ZETA Zeta Global Holdings Corp. | 44 | 52 | 39 | 52 | - | 97.0x | -8.0% | -4.8% | 61.0% | -2.4% | -5.0% | 48.0% | 0.0% | 29.0x | $9.4B | ||
| SECTOR BENCH | - | - | - | - | - | 23.7x | 11.7x | 5.7% | 2.4% | 64.6% | 4.5% | 2.8% | 8.6% | 0.0% | 0.3x | - | REF |
Zeta Global Holdings Corp. (ZETA) receives a "Reduce" rating with a composite score of 43.6/100. It ranks #3043 out of 7,333 stocks in our coverage universe and carries a 2-star rating. Ratings are driven by a 6-factor quantitative model measuring quality, value, momentum, investment, stability, and short interest.
Sign in to join the discussion.
In-line with peers — no strong momentum signal
Fair valuation relative to peers
Average quality profile
Average volatility — neutral timing signal
Aggressive spending — empire-building risk, dilutive growth
Mid-range overall rating
Get full access to institutional-quality research tools with Blank Capital Pro.
Upgrade to ProStarting at $19.99/mo
Relative valuation derived from Services sector benchmarks. Model weights: EV/EBITDA (40%), P/B (35%), P/S (25%). Re-calculated daily.
No analyst ratings for ZETA.
View All Ratings| Factor | Global | Sector | Tilt |
|---|---|---|---|
| PROFITABILITY | 52 | 63 | -11DRAG |
| MOMENTUM | 52 | 53 | -1NEUTRAL |
| VALUATION | 39 | 35 | +4NEUTRAL |
| INVESTMENT | 23 | 8 | +15ALPHA |
| STABILITY | 36 | 31 | +5NEUTRAL |
| SHORT INT | 47 | 45 | +2NEUTRAL |
Global = full universe. Sector = relative to industry peers. Positive tilt indicates idiosyncratic strength.
ROE proxy -8.0% (sector 5.7%)
GM 61% vs sector 65%, OM -2% vs sector 5%
Capital turnover N/A, R&D intensity 9.6%
Rev growth 48%, 5yr history
Interest coverage N/A, Net debt/EBITDA -7.3x
Composite assessment of profitability, capital efficiency, and financial strength. Top-tier entities demonstrate sustainable cash flow generation and elite competitive moats.
Profit generated per dollar of shareholder equity
Efficiency of asset utilization
Pricing power and cost efficiency
Core business profitability
Bottom-line profitability
The Quality factor evaluates the persistence and magnitude of realized cash flows. Companies with scores >70 exhibit superior pricing power and structural financial resilience through diverse economic regimes.
Our uncertainty rating tracks the predictability of future cash flows and potential for permanent capital loss. Moderate visibility with standard industry cyclicality.
We rate Zeta Global Holdings Corp. (ZETA) as a Reduce with a composite score of 43.6/100 at a current price of $17.39. The quantitative profile shows weakness across multiple dimensions, suggesting limited upside potential.
Zeta Global Holdings Corp. holds a top-quartile position (#0 of 50) within the Services sector, based on our composite quantitative scoring across quality, value, momentum, and stability factors. The composite score of 43.6/100 places it at rank #3043 in our full universe.
Narrow
High
Poor
Fair Value
Gross margins of 61% signal strong pricing power.
Stable competitive position in a defensive sector.
Vulnerability to macroeconomic shocks and interest rate volatility.
Zeta Global Holdings Corp. represents a reduce based on multi-factor quantitative performance.
Zeta Global Holdings Corp. receives a Reduce rating from our analysis, with a composite score of 43.6/100 and 2 out of 5 stars, ranking #3043 out of 7,333 stocks. ZETA's factor profile shows weakness across multiple dimensions, suggesting the stock may underperform going forward. Existing holders may want to consider trimming positions or tightening stop-losses.
With a quality score of 52/100, ZETA shows adequate but unremarkable business quality. The company reports a return on equity of -8.0% (sector avg: 5.7%), gross margins of 61.0% (sector avg: 64.6%), net margins of -5.0% (sector avg: 2.8%). This suggests the company generates acceptable returns but may lack the competitive positioning or operational efficiency to stand out from peers.
With a value score of 39/100, ZETA appears somewhat expensive relative to its fundamentals. Key valuation metrics include an EV/EBITDA of 96.95x, a P/B ratio of 5.35x. Investors paying a premium here are likely betting on above-average growth or margin expansion to justify current prices.
Zeta Global Holdings Corp.'s investment score of 23/100 suggests limited reinvestment activity. Key growth metrics include revenue growth of 48.0% vs. a sector average of 8.6% and a return on assets of -4.8% (sector: 2.4%). While this can be positive for mature, cash-generative businesses returning capital to shareholders, it may also signal a lack of growth opportunities or management conservatism.
ZETA demonstrates moderate momentum with a score of 52/100, suggesting a neutral price trend without strong directional conviction. Revenue growth stands at 48.0% year-over-year, while a beta of 2.04 reflects its sensitivity to broader market moves. Moderate momentum may indicate the stock is consolidating or transitioning between trends, warranting close monitoring of upcoming catalysts.
ZETA's stability score of 36/100 signals elevated volatility and/or leverage concerns. Key stability metrics include a beta of 2.04 and a debt-to-equity ratio of 29.00x (sector avg: 0.3x). Investors should be prepared for wider-than-average price swings and consider position sizing accordingly to manage portfolio risk.
The short interest score of 47/100 for ZETA suggests somewhat elevated bearish positioning by institutional traders. Specific risk factors include high market sensitivity (beta: 2.04), elevated leverage (D/E: 29.00x). With a $9.4B market cap (mid-cap), Zeta Global Holdings Corp. may experience above-average volatility. Investors should consider whether the short thesis has merit or if it creates a potential short-squeeze opportunity.
Zeta Global Holdings Corp. is a mid-cap company in the Services sector, ranked #0 of 50 in its sector (100th percentile) and #3043 of 7,333 overall (59th percentile). Key comparisons include ROE of -8.0% trailing the 5.7% sector median and operating margins of -2.4% below the 4.5% sector average. This top-quartile standing reflects exceptional competitive strength relative to Services peers.
While ZETA currently exhibits a REDUCE profile, superior opportunities exist within the SERVICES sector. Our model identifies several "Strong Buy" candidates with higher quality scores and more attractive valuations among direct industry competitors.
View Top Services Alpha →Quant Factor Profile
Upgrade catalyst
Improvement in Investment (23) would have the largest impact on the composite score.
EV/EBITDA 727% ABOVE SECTOR MEDIAN
ROE 240% BELOW SECTOR MEDIAN
Gross Margin 6% BELOW SECTOR MEDIAN
Above 50MA
37.18%
Net New Highs
+51081

The article recommends three growth stocks for 2026: Nvidia, trading below its October highs with strong revenue growth despite AI headwinds; Zeta Global, an AI-powered adtech platform outperforming peers with 36% trailing revenue growth; and Costco, a recession-resistant retailer down 3% over the past year but with consistent growth and 20 consecutive years of dividend increases.
Zeta Global Holdings Corp (ZETA) reports robust revenue growth and raises 2026 guidance, driven by AI innovations and strategic partnerships.
Zeta Global Holdings Corp (NYSE: ZETA) is closing 2025 with significant developments, including the completed acquisition of Marigold's enterprise software business and a subsequent guidance raise for Q4 2025, full-year 2025, and 2026. Analysts generally maintain positive outlooks, with price targets clustering in the high-$20s to $30 range, driven by expectations of AI-powered marketing, loyalty, and an expanded installed base. Investors are now focused on Marigold's integration, potential stock overhang from seller notes, and upcoming CES 2026 announcements for continued growth and profitability.
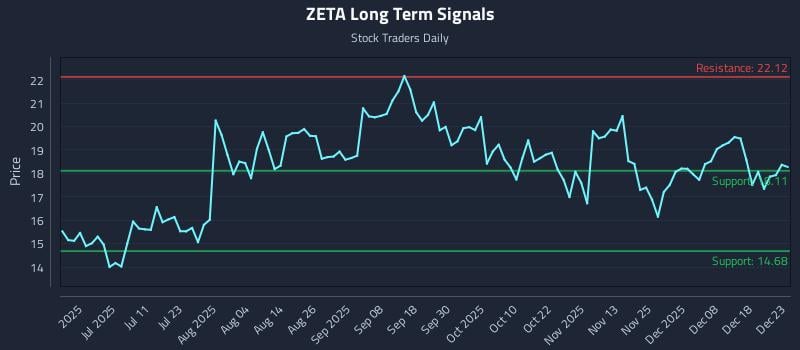
This article from Stock Traders Daily analyzes Zeta Global Holdings Corp. Class A (NASDAQ: ZETA), highlighting a strong near-term sentiment with neutral mid and long-term outlooks. It details AI-generated trading strategies including position, momentum breakout, and risk hedging, alongside multi-timeframe signal analysis with support and resistance levels. The analysis points to an exceptional 80.2:1 risk-reward setup, targeting a significant gain for investors.
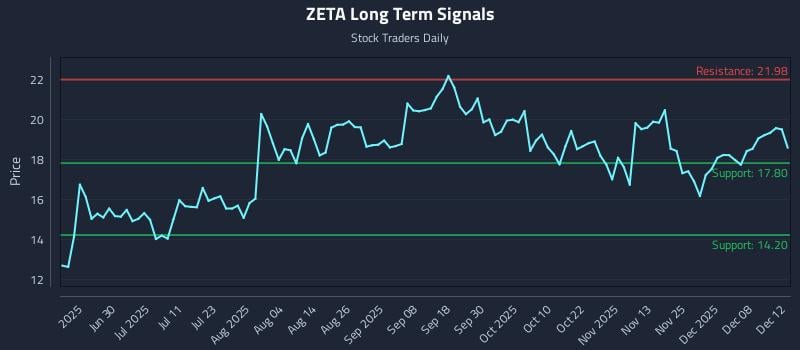
An analysis of Zeta Global Holdings Corp. Class A (NASDAQ: ZETA) identifies a mid-channel oscillation pattern and a strong risk-reward setup targeting a 23.5% gain. The article presents three AI-generated trading strategies—Position, Momentum Breakout, and Risk Hedging—tailored to different risk profiles. It also provides a multi-timeframe signal analysis indicating strong near-term and mid-term sentiment, with specific support and resistance levels.