Equity Research Analysis: Yext, Inc. (YEXT)
|Blank Capital Research Unit|Spot: $5.43
Price$5.43
Composite Score48.7/100
RatingREDUCE (2★)
Rank#2226 OF 7,333
Market Cap$1.0B
P/E Ratio
IMPORTANT DISCLAIMER: Blank Capital Research ("BCR") is a technology platform, not a registered investment advisor or broker-dealer. The algorithmically generated signals, scores, and rankings provided on this site ("God Mode" Signals) are for informational and research purposes only and do not constitute financial advice, investment recommendations, or an offer to sell or solicit an offer to buy any securities.
HYPOTHETICAL PERFORMANCE RESULTS: The "timing scores" and "regime signals" displayed are based on quantitative models. Hypothetical or simulated performance results have certain inherent limitations. Unlike an actual performance record, simulated results do not represent actual trading. Also, since the trades have not actually been executed, the results may have under-or-over compensated for the impact, if any, of certain market factors, such as lack of liquidity.
RISK OF LOSS: Trading in financial markets involves a high degree of risk and may result in the loss of your entire investment. Data provided by third-party sources (Intrinio, Snowflake) is believed to be reliable but is not guaranteed for accuracy or completeness. Past performance is not indicative of future results.
© 2026 Blank Capital Research. All rights reserved. System Version: Aegis V8 (God Mode).
Verdict
Quantitative factor alignment verified for current market regime.
Quant Score
Rank
#2226
Positioning
Market Dominance
Services
Business Services
$1.0B
Michael Walrath
Yext, Inc. organizes business facts to provide answers to consumer questions in North America and internationally. It provides customers to update their information and content through its knowledge network of approximately 200 maps, apps, search engines, intelligent GPS systems, digital assistants, vertical directories, and social networks. It serves healthcare, retail, and financial services industries.
Get full access to institutional-quality research tools with Blank Capital Pro.
Upgrade to ProStarting at $19.99/mo
Get full access to institutional-quality research tools with Blank Capital Pro.
Upgrade to ProStarting at $19.99/mo
Get full access to institutional-quality research tools with Blank Capital Pro.
Upgrade to ProStarting at $19.99/mo
Get full access to institutional-quality research tools with Blank Capital Pro.
Upgrade to ProStarting at $19.99/mo
Get full access to institutional-quality research tools with Blank Capital Pro.
Upgrade to ProStarting at $19.99/mo
X-AXIS: EV/EBITDA (LOWER = CHEAPER) | Y-AXIS: ROE (HIGHER = ELITE) | RED CIRCLE = YEXT ANALYSIS TARGET
| Stock | Rating | Score▼ | Quality | Value | Momentum | P/E | EV/EBITDA | ROE | ROA | Gross Mgn | Op Mgn | Net Mgn | Rev Growth | Div Yield | D/E | Mkt Cap | AUDIT |
|---|---|---|---|---|---|---|---|---|---|---|---|---|---|---|---|---|---|
$YALA Yalla Group Ltd | 75 | 89 | 99 | 80 | - | - | - | - | - | - | - | - | - | - | $0 | VS | |
$GRVY GRAVITY Co., Ltd. | 75 | 82 | 96 | 71 | - | - | - | - | - | - | - | - | - | - | $0 | VS | |
$ISSC INNOVATIVE SOLUTIONS & SUPPORT INC | 73 | 81 | 88 | 94 | 25.0x | 14.1x | 17.1% | 10.3% | 35.5% | 14.6% | 10.1% | 105.2% | 0.0% | 41.0x | $244M | VS | |
$AER AerCap Holdings N.V. | 72 | 60 | 87 | 84 | - | - | - | - | - | - | - | - | - | - | $0 | VS | |
$HCSG HEALTHCARE SERVICES GROUP INC | 72 | 74 | 88 | 88 | 7.1x | 6.1x | 28.9% | 20.8% | 20.8% | 9.9% | 9.3% | 8.5% | 0.0% | 1.0x | $1.2B | VS | |
$LQDT LIQUIDITY SERVICES INC | 72 | 90 | 88 | 68 | 24.9x | 14.3x | 14.1% | 8.3% | 45.7% | 8.5% | 6.2% | 28.1% | 0.0% | 0.0x | $736M | VS | |
$TRTNpA Triton International Ltd | 71 | 70 | 89 | 70 | - | 1.7x | 0.0% | - | 97.4% | 58.0% | 37.4% | - | 8.8% | 264.0x | $2.5B | VS | |
$EDU New Oriental Education & Technology Group Inc. | 71 | 83 | 52 | 77 | - | - | - | - | - | - | - | - | - | - | $0 | VS | |
$NTES NetEase, Inc. | 71 | 88 | 93 | 68 | - | - | - | - | - | - | - | - | - | - | $0 | VS | |
$UTI UNIVERSAL TECHNICAL INSTITUTE INC | 70 | 86 | 86 | 72 | 43.2x | 16.0x | 15.3% | 5.8% | 100.0% | 6.9% | 5.2% | 15.1% | 0.0% | 24.0x | $1.8B | VS | |
$YEXT Yext, Inc. | 49 | 62 | 49 | 51 | 32.6x | 27.6x | 13.4% | 3.8% | 75.3% | 6.3% | 4.7% | 14.4% | 0.0% | 63.0x | $1.0B | ||
| SECTOR BENCH | - | - | - | - | - | 23.7x | 11.7x | 5.7% | 2.4% | 64.6% | 4.5% | 2.8% | 8.6% | 0.0% | 0.3x | - | REF |
Yext, Inc. (YEXT) receives a "Reduce" rating with a composite score of 48.7/100. It ranks #2226 out of 7,333 stocks in our coverage universe and carries a 2-star rating. Ratings are driven by a 6-factor quantitative model measuring quality, value, momentum, investment, stability, and short interest.
Sign in to join the discussion.
In-line with peers — no strong momentum signal
Fair valuation relative to peers
High profitability & efficiency — strong quality floor supports entry
Average volatility — neutral timing signal
Aggressive spending — empire-building risk, dilutive growth
Mid-range overall rating
Get full access to institutional-quality research tools with Blank Capital Pro.
Upgrade to ProStarting at $19.99/mo
Relative valuation derived from Services sector benchmarks. Model weights: EV/EBITDA (40%), P/B (35%), P/S (25%). Re-calculated daily.
Projection based on user-defined inputs. Re-calculated daily against current market data.
Reverse DCF Framework — Mauboussin Methodology
Institutional-grade Reverse DCF analysis. This model identifies the growth hurdles embedded in current market prices. When implied growth is significantly lower than historical or projected rates, a margin of safety may exist. Re-audited daily.
No analyst ratings for YEXT.
View All Ratings| Factor | Global | Sector | Tilt |
|---|---|---|---|
| PROFITABILITY | 62 | 77 | -15DRAG |
| MOMENTUM | 51 | 52 | -1NEUTRAL |
| VALUATION | 49 | 50 | -1NEUTRAL |
| INVESTMENT | 34 | 49 | -15DRAG |
| STABILITY | 57 | 62 | -5NEUTRAL |
| SHORT INT | 35 | 25 | +10ALPHA |
Global = full universe. Sector = relative to industry peers. Positive tilt indicates idiosyncratic strength.
ROE proxy 13.4% (sector 5.7%)
GM 75% vs sector 65%, OM 6% vs sector 5%
Capital turnover N/A, R&D intensity 20.3%
Rev growth 14%, 9yr history
Interest coverage N/A
Composite assessment of profitability, capital efficiency, and financial strength. Top-tier entities demonstrate sustainable cash flow generation and elite competitive moats.
Profit generated per dollar of shareholder equity
Efficiency of asset utilization
Pricing power and cost efficiency
Core business profitability
Bottom-line profitability
The Quality factor evaluates the persistence and magnitude of realized cash flows. Companies with scores >70 exhibit superior pricing power and structural financial resilience through diverse economic regimes.
Our uncertainty rating tracks the predictability of future cash flows and potential for permanent capital loss. Moderate visibility with standard industry cyclicality.
We rate Yext, Inc. (YEXT) as a Reduce with a composite score of 48.7/100 at a current price of $5.43. The quantitative profile shows weakness across multiple dimensions, suggesting limited upside potential.
Yext, Inc. holds a top-quartile position (#0 of 50) within the Services sector, based on our composite quantitative scoring across quality, value, momentum, and stability factors. The composite score of 48.7/100 places it at rank #2226 in our full universe.
Narrow
Low
Standard
Fair Value
Gross margins of 75% signal strong pricing power.
Stable competitive position in a defensive sector.
Vulnerability to macroeconomic shocks and interest rate volatility.
Yext, Inc. represents a reduce based on multi-factor quantitative performance.
Yext, Inc. receives a Reduce rating from our analysis, with a composite score of 48.7/100 and 2 out of 5 stars, ranking #2226 out of 7,333 stocks. YEXT's factor profile shows weakness across multiple dimensions, suggesting the stock may underperform going forward. Existing holders may want to consider trimming positions or tightening stop-losses.
With a quality score of 62/100, YEXT shows adequate but unremarkable business quality. The company reports a return on equity of 13.4% (sector avg: 5.7%), gross margins of 75.3% (sector avg: 64.6%), net margins of 4.7% (sector avg: 2.8%). This suggests the company generates acceptable returns but may lack the competitive positioning or operational efficiency to stand out from peers.
With a value score of 49/100, YEXT appears somewhat expensive relative to its fundamentals. Key valuation metrics include a P/E ratio of 32.59x, an EV/EBITDA of 27.58x, a P/B ratio of 4.38x. Investors paying a premium here are likely betting on above-average growth or margin expansion to justify current prices.
Yext, Inc.'s investment score of 34/100 suggests limited reinvestment activity. Key growth metrics include revenue growth of 14.4% vs. a sector average of 8.6% and a return on assets of 3.8% (sector: 2.4%). While this can be positive for mature, cash-generative businesses returning capital to shareholders, it may also signal a lack of growth opportunities or management conservatism.
YEXT demonstrates moderate momentum with a score of 51/100, suggesting a neutral price trend without strong directional conviction. Revenue growth stands at 14.4% year-over-year, while a beta of 0.67 reflects its sensitivity to broader market moves. Moderate momentum may indicate the stock is consolidating or transitioning between trends, warranting close monitoring of upcoming catalysts.
With a stability score of 57/100, YEXT exhibits average financial resilience. Key stability metrics include a beta of 0.67 and a debt-to-equity ratio of 63.00x (sector avg: 0.3x). While the balance sheet is not a major concern, the stock is subject to typical market volatility and may experience sharper drawdowns during risk-off episodes.
Yext, Inc.'s short interest score of 35/100 reveals significant bearish positioning, suggesting institutional investors are actively betting against the stock. Specific risk factors include elevated leverage (D/E: 63.00x), small-cap liquidity risk. At $1.0B (small-cap), YEXT carries meaningful risk and is best suited for investors with high risk tolerance who have thoroughly evaluated the bear thesis.
Yext, Inc. is a small-cap company in the Services sector, ranked #0 of 50 in its sector (100th percentile) and #2226 of 7,333 overall (70th percentile). Key comparisons include ROE of 13.4% exceeding the 5.7% sector median and operating margins of 6.3% above the 4.5% sector average. This top-quartile standing reflects exceptional competitive strength relative to Services peers.
While YEXT currently exhibits a REDUCE profile, superior opportunities exist within the SERVICES sector. Our model identifies several "Strong Buy" candidates with higher quality scores and more attractive valuations among direct industry competitors.
View Top Services Alpha →Quant Factor Profile
Upgrade catalyst
Improvement in Investment (34) would have the largest impact on the composite score.
EV/EBITDA 135% ABOVE SECTOR MEDIAN
ROE 134% ABOVE SECTOR MEDIAN (FAVORABLE)
Gross Margin 17% ABOVE SECTOR MEDIAN (FAVORABLE)
Above 50MA
37.18%
Net New Highs
+51081
Glancy Prongay Wolke & Rotter LLP has launched a securities fraud investigation into Yext, Inc. (YEXT) after its CEO withdrew an acquisition proposal due to inability to secure financing. This news caused Yext's stock price to drop significantly, injuring investors. The law firm is urging affected shareholders to contact them to discuss potential claims and participation in the investigation.
The Law Offices of Frank R. Cruz has announced an investigation into Yext, Inc. (YEXT) for potential federal securities law violations. This follows a significant drop in Yext's stock price after CEO Michael Walrath withdrew his acquisition proposal, stating he couldn't obtain necessary financing despite prior claims of reputable backing. Shareholders who lost money are encouraged to contact the law firm to explore potential claims.

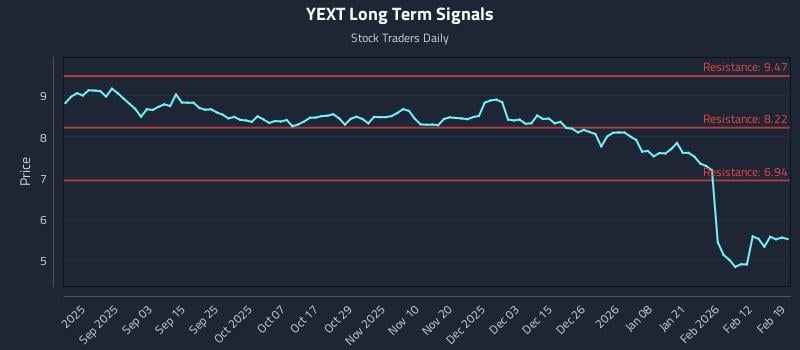
Yext CEO Michael Walrath has withdrawn his $9 per share buyout proposal for the company, citing an inability to secure necessary financing. Following this, Yext's Special Committee approved a Dutch auction self-tender offer of $150 million of its common stock, expected to commence in February 2026 and potentially funded through debt. The company, which helps businesses manage their digital presence, remains optimistic about its future, with analysts forecasting EPS growth for fiscal year 2026 despite a recent revenue miss.
Yext CEO Michael Walrath has withdrawn his non-binding proposal to acquire all outstanding shares of the company not already owned by him, citing an inability to obtain the necessary financing. Following this, Yext's Board of Directors, through a Special Committee, approved a "Dutch auction" self-tender offer to repurchase $150 million of its common stock. The self-tender is expected to commence in February 2026, with details to be filed with the SEC.
This article analyzes Yext Inc. (NASDAQ: YEXT) using AI models to provide insights into its price events and liquidity mapping. It identifies divergent sentiment across all time horizons, suggesting choppy conditions with elevated downside risk. The analysis offers three distinct trading strategies (Position, Momentum Breakout, Risk Hedging) tailored to different risk profiles.