Equity Research Analysis: Hello Group Inc. (MOMO)
|Blank Capital Research Unit|Spot: $6.66
Price$6.66
Composite Score61.8/100
RatingHOLD (3★)
Rank#525 OF 7,333
Market Cap$1.4B
IMPORTANT DISCLAIMER: Blank Capital Research ("BCR") is a technology platform, not a registered investment advisor or broker-dealer. The algorithmically generated signals, scores, and rankings provided on this site ("God Mode" Signals) are for informational and research purposes only and do not constitute financial advice, investment recommendations, or an offer to sell or solicit an offer to buy any securities.
HYPOTHETICAL PERFORMANCE RESULTS: The "timing scores" and "regime signals" displayed are based on quantitative models. Hypothetical or simulated performance results have certain inherent limitations. Unlike an actual performance record, simulated results do not represent actual trading. Also, since the trades have not actually been executed, the results may have under-or-over compensated for the impact, if any, of certain market factors, such as lack of liquidity.
RISK OF LOSS: Trading in financial markets involves a high degree of risk and may result in the loss of your entire investment. Data provided by third-party sources (Intrinio, Snowflake) is believed to be reliable but is not guaranteed for accuracy or completeness. Past performance is not indicative of future results.
© 2026 Blank Capital Research. All rights reserved. System Version: Aegis V8 (God Mode).
Verdict
Quantitative factor alignment verified for current market regime.
Quant Score
Rank
#525
Positioning
Market Dominance
Services
Computer Software
$1.4B
Yan Tang
Hello Group Inc. provides mobile-based social and entertainment services in the People's Republic of China. The company's Momo mobile application connects people and facilitates interactions based on location and interests. It also operates Tantan, a social and dating application, which enables users to find and establish romantic connections, and meet interesting people.
Get full access to institutional-quality research tools with Blank Capital Pro.
Upgrade to ProStarting at $19.99/mo
Get full access to institutional-quality research tools with Blank Capital Pro.
Upgrade to ProStarting at $19.99/mo
Dates updated upon official exchange announcement.
Get full access to institutional-quality research tools with Blank Capital Pro.
Upgrade to ProStarting at $19.99/mo
Get full access to institutional-quality research tools with Blank Capital Pro.
Upgrade to ProStarting at $19.99/mo
Get full access to institutional-quality research tools with Blank Capital Pro.
Upgrade to ProStarting at $19.99/mo
X-AXIS: EV/EBITDA (LOWER = CHEAPER) | Y-AXIS: ROE (HIGHER = ELITE) | RED CIRCLE = MOMO ANALYSIS TARGET
| Stock | Rating | Score▼ | Quality | Value | Momentum | P/E | EV/EBITDA | ROE | ROA | Gross Mgn | Op Mgn | Net Mgn | Rev Growth | Div Yield | D/E | Mkt Cap | AUDIT |
|---|---|---|---|---|---|---|---|---|---|---|---|---|---|---|---|---|---|
$YALA Yalla Group Ltd | 75 | 89 | 99 | 80 | - | - | - | - | - | - | - | - | - | - | $0 | VS | |
$GRVY GRAVITY Co., Ltd. | 75 | 82 | 96 | 71 | - | - | - | - | - | - | - | - | - | - | $0 | VS | |
$ISSC INNOVATIVE SOLUTIONS & SUPPORT INC | 73 | 81 | 88 | 94 | 25.0x | 14.1x | 17.1% | 10.3% | 35.5% | 14.6% | 10.1% | 105.2% | 0.0% | 41.0x | $244M | VS | |
$AER AerCap Holdings N.V. | 72 | 60 | 87 | 84 | - | - | - | - | - | - | - | - | - | - | $0 | VS | |
$HCSG HEALTHCARE SERVICES GROUP INC | 72 | 74 | 88 | 88 | 7.1x | 6.1x | 28.9% | 20.8% | 20.8% | 9.9% | 9.3% | 8.5% | 0.0% | 1.0x | $1.2B | VS | |
$LQDT LIQUIDITY SERVICES INC | 72 | 90 | 88 | 68 | 24.9x | 14.3x | 14.1% | 8.3% | 45.7% | 8.5% | 6.2% | 28.1% | 0.0% | 0.0x | $736M | VS | |
$TRTNpA Triton International Ltd | 71 | 70 | 89 | 70 | - | 1.7x | 0.0% | - | 97.4% | 58.0% | 37.4% | - | 8.8% | 264.0x | $2.5B | VS | |
$EDU New Oriental Education & Technology Group Inc. | 71 | 83 | 52 | 77 | - | - | - | - | - | - | - | - | - | - | $0 | VS | |
$NTES NetEase, Inc. | 71 | 88 | 93 | 68 | - | - | - | - | - | - | - | - | - | - | $0 | VS | |
$UTI UNIVERSAL TECHNICAL INSTITUTE INC | 70 | 86 | 86 | 72 | 43.2x | 16.0x | 15.3% | 5.8% | 100.0% | 6.9% | 5.2% | 15.1% | 0.0% | 24.0x | $1.8B | VS | |
$MOMO Hello Group Inc. | 62 | 76 | 94 | 54 | 17.3x | 1.3x | 37.0% | 22.6% | 39.0% | 14.5% | 9.8% | -14.4% | 17.3% | 39.0x | $1.4B | ||
| SECTOR BENCH | - | - | - | - | - | 23.7x | 11.7x | 5.7% | 2.4% | 64.6% | 4.5% | 2.8% | 8.6% | 0.0% | 0.3x | - | REF |
Hello Group Inc. (MOMO) receives a "Hold" rating with a composite score of 61.8/100. It ranks #525 out of 7,333 stocks in our coverage universe and carries a 3-star rating. Ratings are driven by a 6-factor quantitative model measuring quality, value, momentum, investment, stability, and short interest.
Sign in to join the discussion.
Headcount
2.0K
HQ Base
BEIJING,
In-line with peers — no strong momentum signal
Trading at a discount to fundamentals — favorable entry valuation
High profitability & efficiency — strong quality floor supports entry
Low volatility — smoother ride and historically better risk-adjusted returns
Moderate investment profile
Mid-range overall rating
Get full access to institutional-quality research tools with Blank Capital Pro.
Upgrade to ProStarting at $19.99/mo
Relative valuation derived from Services sector benchmarks. Model weights: EV/EBITDA (40%), P/B (35%), P/S (25%). Re-calculated daily.
Projection based on user-defined inputs. Re-calculated daily against current market data.
Reverse DCF Framework — Mauboussin Methodology
Institutional-grade Reverse DCF analysis. This model identifies the growth hurdles embedded in current market prices. When implied growth is significantly lower than historical or projected rates, a margin of safety may exist. Re-audited daily.
No analyst ratings for MOMO.
View All Ratings| Factor | Global | Sector | Tilt |
|---|---|---|---|
| PROFITABILITY | 76 | 91 | -15DRAG |
| MOMENTUM | 54 | 55 | -1NEUTRAL |
| VALUATION | 94 | 98 | -4NEUTRAL |
| INVESTMENT | 46 | 81 | -35DRAG |
| STABILITY | 86 | 93 | -7DRAG |
| SHORT INT | 37 | 29 | +8ALPHA |
Global = full universe. Sector = relative to industry peers. Positive tilt indicates idiosyncratic strength.
ROIC 242.1% vs WACC 6.7% (spread +235.4%)
GM 39% vs sector 65%, OM 15% vs sector 5%
Capital turnover 33.37x, R&D intensity 7.6%
Rev growth -14%, 9yr history
Interest coverage 12.0x, Net debt/EBITDA 0.2x
Composite assessment of profitability, capital efficiency, and financial strength. Top-tier entities demonstrate sustainable cash flow generation and elite competitive moats.
Profit generated per dollar of shareholder equity
Efficiency of asset utilization
Pricing power and cost efficiency
Core business profitability
Bottom-line profitability
The Quality factor evaluates the persistence and magnitude of realized cash flows. Companies with scores >70 exhibit superior pricing power and structural financial resilience through diverse economic regimes.
Our uncertainty rating tracks the predictability of future cash flows and potential for permanent capital loss. Moderate visibility with standard industry cyclicality.
We rate Hello Group Inc. (MOMO) as a Hold with a composite score of 61.8/100 at a current price of $6.66. The stock presents a mixed quantitative picture — neither compelling enough to warrant new accumulation nor weak enough to justify selling.
Hello Group Inc. holds a top-quartile position (#0 of 50) within the Services sector, based on our composite quantitative scoring across quality, value, momentum, and stability factors. The composite score of 61.8/100 places it at rank #525 in our full universe.
Narrow
Low
Exemplary
Undervalued
Returns on equity of 37.0% exceed cost of capital.
Value factor score of 94 suggests attractive pricing.
Stable competitive position in a defensive sector.
Vulnerability to macroeconomic shocks and interest rate volatility.
Hello Group Inc. represents a hold based on multi-factor quantitative performance.
Our model assigns Hello Group Inc. a Hold rating, with a composite score of 61.8/100 and 3 out of 5 stars. Ranked #525 of 7,333 stocks, MOMO presents a mixed quantitative picture — neither compelling enough to initiate new positions nor weak enough to warrant selling. Investors already holding may consider maintaining their position while monitoring for changes in the factor profile.
MOMO earns a quality score of 76/100, indicating above-average business quality. The company reports a return on equity of 37.0% (sector avg: 5.7%), gross margins of 39.0% (sector avg: 64.6%), net margins of 9.8% (sector avg: 2.8%). Companies in this tier generally demonstrate consistent profitability and efficient capital deployment, though they may face some competitive pressure.
From a valuation perspective, MOMO scores an exceptional 94/100, indicating the stock trades at a deep discount relative to its fundamentals. Key valuation metrics include a P/E ratio of 17.32x, an EV/EBITDA of 1.27x, a P/B ratio of 0.69x. A value score this high suggests the market may be significantly underpricing the company's earnings power, assets, or cash flow generation.
With an investment score of 46/100, MOMO exhibits moderate growth-oriented spending. Key growth metrics include revenue growth of -14.4% vs. a sector average of 8.6% and a return on assets of 22.6% (sector: 2.4%). The company appears to be balancing growth investments with capital returns, though the pace of investment may not be enough to accelerate top-line growth meaningfully.
MOMO demonstrates moderate momentum with a score of 54/100, suggesting a neutral price trend without strong directional conviction. Revenue growth stands at -14.4% year-over-year, while a beta of 0.64 reflects its sensitivity to broader market moves. Moderate momentum may indicate the stock is consolidating or transitioning between trends, warranting close monitoring of upcoming catalysts.
Hello Group Inc. earns an excellent stability score of 86/100, reflecting low price volatility and a conservatively managed balance sheet. Key stability metrics include a beta of 0.64 and a debt-to-equity ratio of 39.00x (sector avg: 0.3x). Stocks with this level of stability tend to act as portfolio anchors, providing downside protection during market corrections while still participating in broad market advances.
Hello Group Inc.'s short interest score of 37/100 reveals significant bearish positioning, suggesting institutional investors are actively betting against the stock. Specific risk factors include elevated leverage (D/E: 39.00x), small-cap liquidity risk. At $1.4B (small-cap), MOMO carries meaningful risk and is best suited for investors with high risk tolerance who have thoroughly evaluated the bear thesis.
Hello Group Inc. offers an attractive dividend yield of 17.3%, placing it among the higher-yielding stocks in its peer group. A yield this high can provide meaningful income, but investors should verify the payout is sustainable by examining the payout ratio, free cash flow coverage, and any history of dividend cuts.
Hello Group Inc. is a small-cap company in the Services sector, ranked #0 of 50 in its sector (100th percentile) and #525 of 7,333 overall (93rd percentile). Key comparisons include ROE of 37.0% exceeding the 5.7% sector median and operating margins of 14.5% above the 4.5% sector average. This top-quartile standing reflects exceptional competitive strength relative to Services peers.
While MOMO currently exhibits a HOLD profile, superior opportunities exist within the SERVICES sector. Our model identifies several "Strong Buy" candidates with higher quality scores and more attractive valuations among direct industry competitors.
View Top Services Alpha →Quant Factor Profile
Key factor gap
Value (94) vs Short Int. (37) — closing this gap could shift the rating.
EV/EBITDA 89% BELOW SECTOR MEDIAN (FAVORABLE)
ROE 544% ABOVE SECTOR MEDIAN (FAVORABLE)
Gross Margin 40% BELOW SECTOR MEDIAN
Above 50MA
37.18%
Net New Highs
+51081
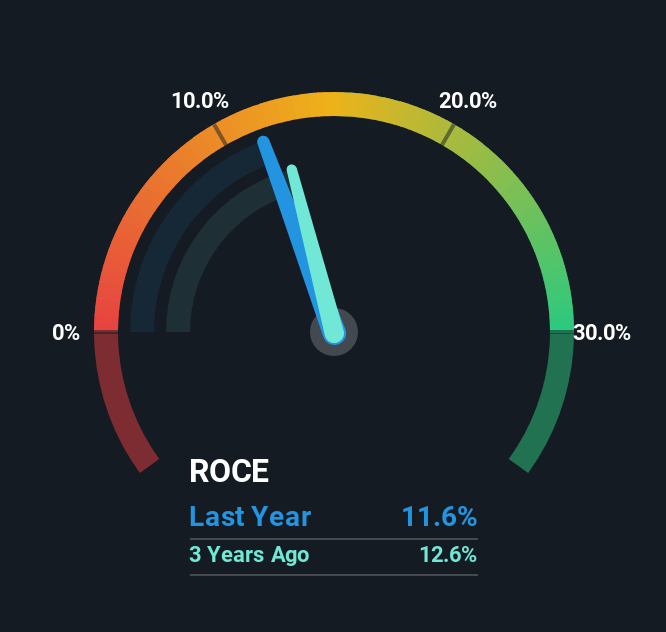
Hello Group (NASDAQ:MOMO) is showing concerning signs of decline, with a decreasing return on capital employed (ROCE) and a shrinking capital base over the last five years. While its current ROCE of 12% is satisfactory in absolute terms and better than the industry average, the consistent decline and the company employing 40% less capital suggest tough times ahead. The stock has already fallen 33% over the past five years, indicating that investors are recognizing these negative trends.
Hello Group Inc. (NASDAQ: MOMO) (the "Company"), a leading player in Asia's online social networking space, today announced that it will release its unaudited financial results for the fourth quarter and fiscal year ended December 31, 2025 before U.S. markets open on Wednesday, March 18, 2026.
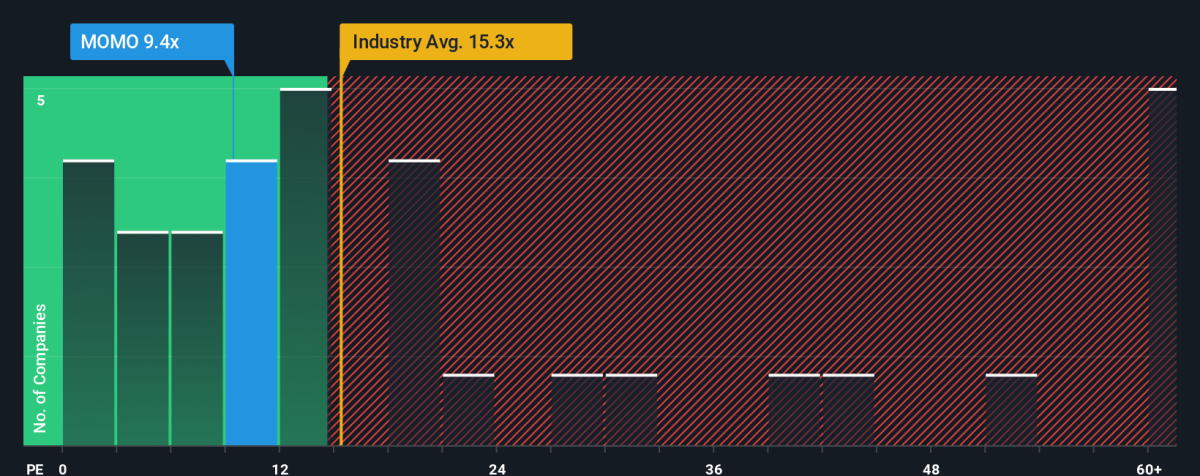
Hello Group Inc. (NASDAQ:MOMO) exhibits a low P/E ratio of 9.4x, which normally suggests a bullish signal compared to the broader U.S. market. However, the company's past earnings have declined by 40%, raising concerns despite analysts forecasting a 21% growth for the next year, outpacing the market's 16% prediction. Investors' skepticism regarding the company's ability to meet these growth expectations seems to be repressing its P/E ratio.
When close to half the companies in the United States have price-to-earnings ratios (or "P/E's") above 20x, you may...
When researching a stock for investment, what can tell us that the company is in decline? Typically, we'll see the...