Equity Research Analysis: Grab Holdings Ltd (GRAB)
|Blank Capital Research Unit|Spot: $4.15
Price$4.15
Composite Score46.2/100
RatingREDUCE (2★)
Rank#2612 OF 7,333
Market Cap$18.7B
IMPORTANT DISCLAIMER: Blank Capital Research ("BCR") is a technology platform, not a registered investment advisor or broker-dealer. The algorithmically generated signals, scores, and rankings provided on this site ("God Mode" Signals) are for informational and research purposes only and do not constitute financial advice, investment recommendations, or an offer to sell or solicit an offer to buy any securities.
HYPOTHETICAL PERFORMANCE RESULTS: The "timing scores" and "regime signals" displayed are based on quantitative models. Hypothetical or simulated performance results have certain inherent limitations. Unlike an actual performance record, simulated results do not represent actual trading. Also, since the trades have not actually been executed, the results may have under-or-over compensated for the impact, if any, of certain market factors, such as lack of liquidity.
RISK OF LOSS: Trading in financial markets involves a high degree of risk and may result in the loss of your entire investment. Data provided by third-party sources (Intrinio, Snowflake) is believed to be reliable but is not guaranteed for accuracy or completeness. Past performance is not indicative of future results.
© 2026 Blank Capital Research. All rights reserved. System Version: Aegis V8 (God Mode).
Verdict
Quantitative factor alignment verified for current market regime.
Quant Score
Rank
#2612
Positioning
Market Dominance
Services
Business Services
$18.7B
Ping Y. Tan
Grab Holdings Limited operates a transportation and fintech platform in Southeast Asia. It offers a range of services, including mobility, food, package and grocery delivery services, mobile payments, and financial services. Grab Holdings was founded in 2012 and is based in Singapore.
Get full access to institutional-quality research tools with Blank Capital Pro.
Upgrade to ProStarting at $19.99/mo
Get full access to institutional-quality research tools with Blank Capital Pro.
Upgrade to ProStarting at $19.99/mo
Get full access to institutional-quality research tools with Blank Capital Pro.
Upgrade to ProStarting at $19.99/mo
Get full access to institutional-quality research tools with Blank Capital Pro.
Upgrade to ProStarting at $19.99/mo
Get full access to institutional-quality research tools with Blank Capital Pro.
Upgrade to ProStarting at $19.99/mo
X-AXIS: EV/EBITDA (LOWER = CHEAPER) | Y-AXIS: ROE (HIGHER = ELITE) | RED CIRCLE = GRAB ANALYSIS TARGET
| Stock | Rating | Score▼ | Quality | Value | Momentum | P/E | EV/EBITDA | ROE | ROA | Gross Mgn | Op Mgn | Net Mgn | Rev Growth | Div Yield | D/E | Mkt Cap | AUDIT |
|---|---|---|---|---|---|---|---|---|---|---|---|---|---|---|---|---|---|
$YALA Yalla Group Ltd | 75 | 89 | 99 | 80 | - | - | - | - | - | - | - | - | - | - | $0 | VS | |
$GRVY GRAVITY Co., Ltd. | 75 | 82 | 96 | 71 | - | - | - | - | - | - | - | - | - | - | $0 | VS | |
$ISSC INNOVATIVE SOLUTIONS & SUPPORT INC | 73 | 81 | 88 | 94 | 25.0x | 14.1x | 17.1% | 10.3% | 35.5% | 14.6% | 10.1% | 105.2% | 0.0% | 41.0x | $244M | VS | |
$AER AerCap Holdings N.V. | 72 | 60 | 87 | 84 | - | - | - | - | - | - | - | - | - | - | $0 | VS | |
$HCSG HEALTHCARE SERVICES GROUP INC | 72 | 74 | 88 | 88 | 7.1x | 6.1x | 28.9% | 20.8% | 20.8% | 9.9% | 9.3% | 8.5% | 0.0% | 1.0x | $1.2B | VS | |
$LQDT LIQUIDITY SERVICES INC | 72 | 90 | 88 | 68 | 24.9x | 14.3x | 14.1% | 8.3% | 45.7% | 8.5% | 6.2% | 28.1% | 0.0% | 0.0x | $736M | VS | |
$TRTNpA Triton International Ltd | 71 | 70 | 89 | 70 | - | 1.7x | 0.0% | - | 97.4% | 58.0% | 37.4% | - | 8.8% | 264.0x | $2.5B | VS | |
$EDU New Oriental Education & Technology Group Inc. | 71 | 83 | 52 | 77 | - | - | - | - | - | - | - | - | - | - | $0 | VS | |
$NTES NetEase, Inc. | 71 | 88 | 93 | 68 | - | - | - | - | - | - | - | - | - | - | $0 | VS | |
$UTI UNIVERSAL TECHNICAL INSTITUTE INC | 70 | 86 | 86 | 72 | 43.2x | 16.0x | 15.3% | 5.8% | 100.0% | 6.9% | 5.2% | 15.1% | 0.0% | 24.0x | $1.8B | VS | |
$GRAB Grab Holdings Ltd | 46 | 44 | 33 | 51 | - | - | -2.7% | -6.8% | 41.8% | -6.0% | -5.7% | 18.6% | 0.0% | 2.0x | $18.7B | ||
| SECTOR BENCH | - | - | - | - | - | 23.7x | 11.7x | 5.7% | 2.4% | 64.6% | 4.5% | 2.8% | 8.6% | 0.0% | 0.3x | - | REF |
Grab Holdings Ltd (GRAB) receives a "Reduce" rating with a composite score of 46.2/100. It ranks #2612 out of 7,333 stocks in our coverage universe and carries a 2-star rating. Ratings are driven by a 6-factor quantitative model measuring quality, value, momentum, investment, stability, and short interest.
Sign in to join the discussion.
In-line with peers — no strong momentum signal
Expensive relative to fundamentals — limited margin of safety
Average quality profile
Low volatility — smoother ride and historically better risk-adjusted returns
Moderate investment profile
Mid-range overall rating
Get full access to institutional-quality research tools with Blank Capital Pro.
Upgrade to ProStarting at $19.99/mo
Relative valuation derived from Services sector benchmarks. Model weights: EV/EBITDA (40%), P/B (35%), P/S (25%). Re-calculated daily.
No analyst ratings for GRAB.
View All Ratings| Factor | Global | Sector | Tilt |
|---|---|---|---|
| PROFITABILITY | 44 | 43 | +1NEUTRAL |
| MOMENTUM | 51 | 51 | 0NEUTRAL |
| VALUATION | 33 | 27 | +6ALPHA |
| INVESTMENT | 58 | 94 | -36DRAG |
| STABILITY | 63 | 68 | -5NEUTRAL |
| SHORT INT | 42 | 36 | +6ALPHA |
Global = full universe. Sector = relative to industry peers. Positive tilt indicates idiosyncratic strength.
ROE proxy -2.7% (sector 5.7%)
GM 42% vs sector 65%, OM -6% vs sector 5%
Capital turnover N/A, R&D intensity 14.7%
Rev growth 19%, 4yr history
Interest coverage -1.6x
Composite assessment of profitability, capital efficiency, and financial strength. Top-tier entities demonstrate sustainable cash flow generation and elite competitive moats.
Profit generated per dollar of shareholder equity
Efficiency of asset utilization
Pricing power and cost efficiency
Core business profitability
Bottom-line profitability
The Quality factor evaluates the persistence and magnitude of realized cash flows. Companies with scores >70 exhibit superior pricing power and structural financial resilience through diverse economic regimes.
Our uncertainty rating tracks the predictability of future cash flows and potential for permanent capital loss. Moderate visibility with standard industry cyclicality.
We rate Grab Holdings Ltd (GRAB) as a Reduce with a composite score of 46.2/100 at a current price of $4.15. The quantitative profile shows weakness across multiple dimensions, suggesting limited upside potential.
Grab Holdings Ltd holds a top-quartile position (#0 of 50) within the Services sector, based on our composite quantitative scoring across quality, value, momentum, and stability factors. The composite score of 46.2/100 places it at rank #2612 in our full universe.
Narrow
High
Poor
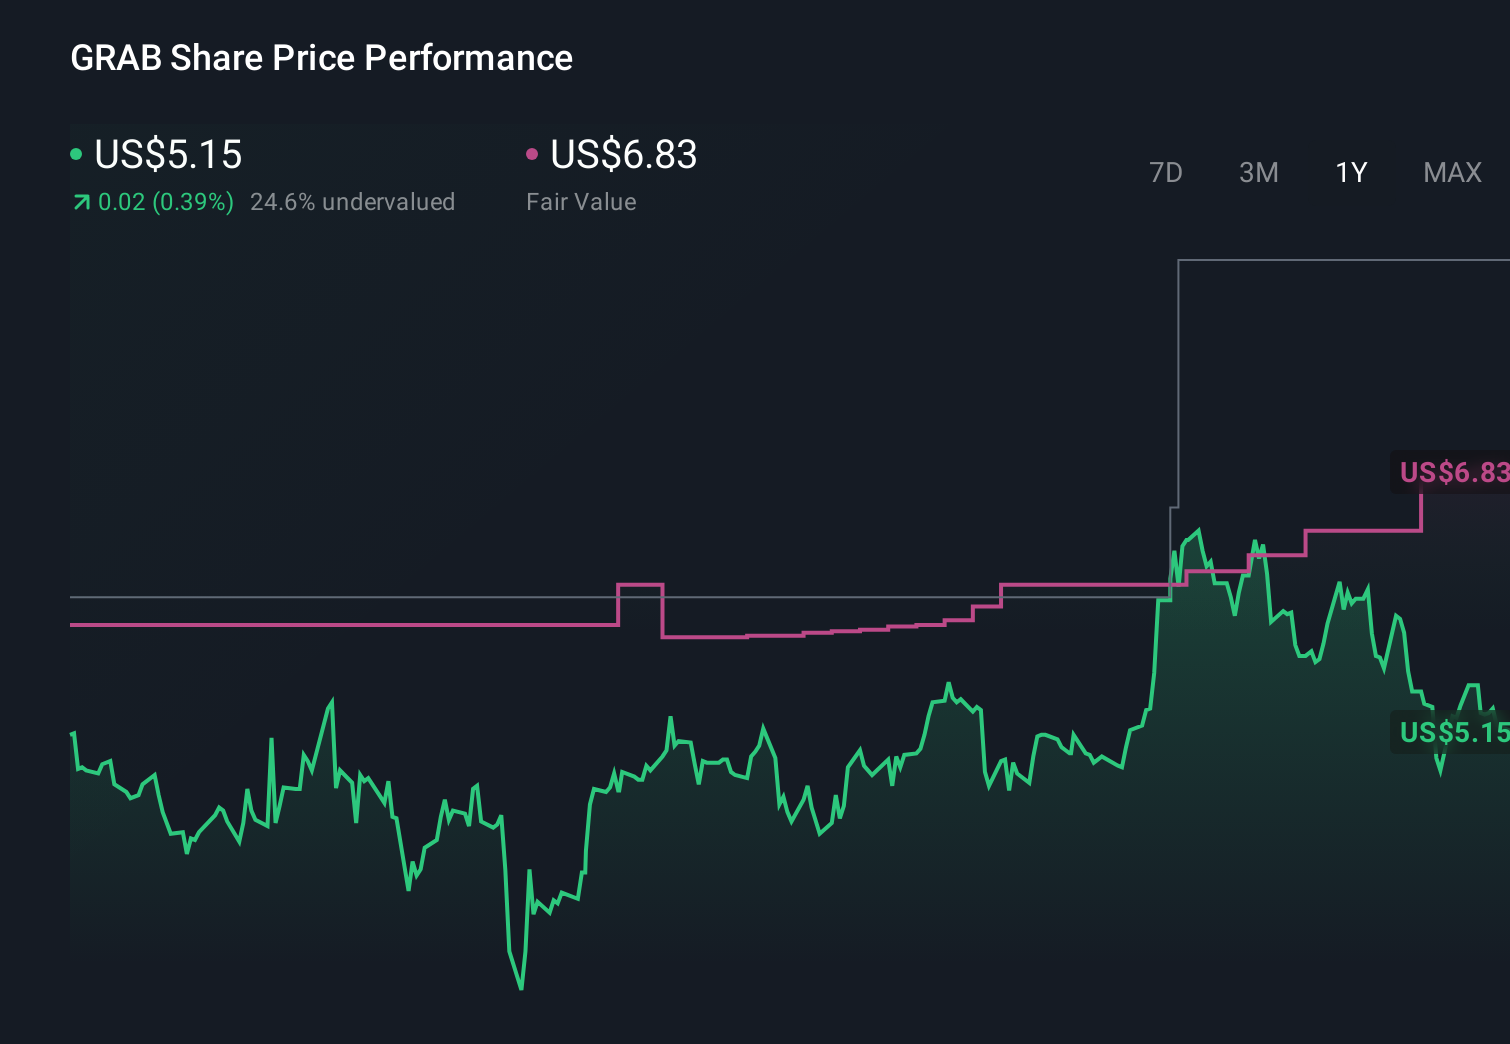
Fair Value
Gross margins of 42% signal strong pricing power.
Stable competitive position in a defensive sector.
Vulnerability to macroeconomic shocks and interest rate volatility.
Grab Holdings Ltd represents a reduce based on multi-factor quantitative performance.
Grab Holdings Ltd receives a Reduce rating from our analysis, with a composite score of 46.2/100 and 2 out of 5 stars, ranking #2612 out of 7,333 stocks. GRAB's factor profile shows weakness across multiple dimensions, suggesting the stock may underperform going forward. Existing holders may want to consider trimming positions or tightening stop-losses.
GRAB's quality score of 44/100 is below average, suggesting challenges with profitability or capital efficiency. The company reports a return on equity of -2.7% (sector avg: 5.7%), gross margins of 41.8% (sector avg: 64.6%), net margins of -5.7% (sector avg: 2.8%). Investors should examine whether management is actively addressing these weaknesses or if they reflect structural industry headwinds.
With a value score of 33/100, GRAB appears somewhat expensive relative to its fundamentals. Key valuation metrics include a P/B ratio of 0.76x. Investors paying a premium here are likely betting on above-average growth or margin expansion to justify current prices.
With an investment score of 58/100, GRAB exhibits moderate growth-oriented spending. Key growth metrics include revenue growth of 18.6% vs. a sector average of 8.6% and a return on assets of -6.8% (sector: 2.4%). The company appears to be balancing growth investments with capital returns, though the pace of investment may not be enough to accelerate top-line growth meaningfully.
GRAB demonstrates moderate momentum with a score of 51/100, suggesting a neutral price trend without strong directional conviction. Revenue growth stands at 18.6% year-over-year, while a beta of 1.44 reflects its sensitivity to broader market moves. Moderate momentum may indicate the stock is consolidating or transitioning between trends, warranting close monitoring of upcoming catalysts.
With a stability score of 63/100, GRAB exhibits average financial resilience. Key stability metrics include a beta of 1.44 and a debt-to-equity ratio of 2.00x (sector avg: 0.3x). While the balance sheet is not a major concern, the stock is subject to typical market volatility and may experience sharper drawdowns during risk-off episodes.
The short interest score of 42/100 for GRAB suggests somewhat elevated bearish positioning by institutional traders. Specific risk factors include above-average market sensitivity (beta: 1.44). With a $18.7B market cap (large-cap), Grab Holdings Ltd may experience above-average volatility. Investors should consider whether the short thesis has merit or if it creates a potential short-squeeze opportunity.
Grab Holdings Ltd is a large-cap company in the Services sector, ranked #0 of 50 in its sector (100th percentile) and #2612 of 7,333 overall (64th percentile). Key comparisons include ROE of -2.7% trailing the 5.7% sector median and operating margins of -6.0% below the 4.5% sector average. This top-quartile standing reflects exceptional competitive strength relative to Services peers.
While GRAB currently exhibits a REDUCE profile, superior opportunities exist within the SERVICES sector. Our model identifies several "Strong Buy" candidates with higher quality scores and more attractive valuations among direct industry competitors.
View Top Services Alpha →Quant Factor Profile
Upgrade catalyst
Improvement in Value (33) would have the largest impact on the composite score.
ROE 147% BELOW SECTOR MEDIAN
Gross Margin 35% BELOW SECTOR MEDIAN
Op. Margin 234% BELOW SECTOR MEDIAN

Indonesia's newly launched sovereign wealth fund, Danantara Indonesia, is reportedly in early discussions to acquire a minority stake in the potential combined entity resulting from Grab's proposed buyout of GoTo. This move could help alleviate Indonesian government concerns about Singapore-headquartered Grab owning the country's largest tech firm. The deal, which could value GoTo at around $7 billion, has slowed due to potential regulatory demands, and Indonesia's antitrust regulator is also researching risks associated with the merger.
Grab Holdings Ltd. has acquired Singaporean restaurant reservation app Chope for an undisclosed sum to expand its service offerings and counter competition in the Southeast Asian market. This acquisition will add dinner bookings to Grab's platform and integrate Chope's operations and staff into Grab's Omnicommerce business, aiming to bolster its ecosystem and advertising sales without impacting its positive-adjusted Ebitda. The move intensifies Grab's strategy to move beyond core ride-hailing and food delivery services in the competitive region.
Grab (GRAB) has a dominant market share in Southeast Asia's deliveries, mobility, and financial services, despite its stock price being down 70% since its 2021 IPO. The company is poised for future growth due to its financial services segment, rising tourism in Singapore, increasing cost-efficiency, and expanding customer base, making it a "buy" recommendation.
Grab Holdings Ltd. (NasdaqGS:GRAB) has achieved its first full year of net profit, reporting US$268 million in 2025 revenue. This milestone is accompanied by a new $500 million share buyback program and strategic expansion into wealth services through the acquisition of Stash Financial, alongside a partnership with Hesai Technology for lidar distribution. These moves signal a significant shift for the company, balancing capital returns to investors with investments in new growth areas, prompting investors to consider both the risks and rewards of these strategic directions.
Grab Holdings Limited reported its first full year net profit in 2025, reaching $200 million on revenue of $3.37 billion, a 20% year-over-year increase. The company also saw Adjusted EBITDA rise to $500 million and its Board authorized a new $500 million share repurchase program for Class A ordinary shares. Grab provided a positive outlook, guiding 2026 revenue to $4.04–$4.10 billion and Adjusted EBITDA to $700–$720 million, with a 2028 target of $1.5 billion Adjusted EBITDA.
Above 50MA
37.18%
Net New Highs
+51081