Equity Research Analysis: PEABODY ENERGY CORP (BTU)
|Blank Capital Research Unit|Spot: $33.95
Price$33.95
Composite Score51.6/100
RatingHOLD (3★)
Rank#1768 OF 7,333
Market Cap$3.2B
IMPORTANT DISCLAIMER: Blank Capital Research ("BCR") is a technology platform, not a registered investment advisor or broker-dealer. The algorithmically generated signals, scores, and rankings provided on this site ("God Mode" Signals) are for informational and research purposes only and do not constitute financial advice, investment recommendations, or an offer to sell or solicit an offer to buy any securities.
HYPOTHETICAL PERFORMANCE RESULTS: The "timing scores" and "regime signals" displayed are based on quantitative models. Hypothetical or simulated performance results have certain inherent limitations. Unlike an actual performance record, simulated results do not represent actual trading. Also, since the trades have not actually been executed, the results may have under-or-over compensated for the impact, if any, of certain market factors, such as lack of liquidity.
RISK OF LOSS: Trading in financial markets involves a high degree of risk and may result in the loss of your entire investment. Data provided by third-party sources (Intrinio, Snowflake) is believed to be reliable but is not guaranteed for accuracy or completeness. Past performance is not indicative of future results.
© 2026 Blank Capital Research. All rights reserved. System Version: Aegis V8 (God Mode).
Verdict
Quantitative factor alignment verified for current market regime.
Quant Score
Rank
#1768
Positioning
Market Dominance
Mining
Coal
$3.2B
James C. Grech
Peabody Energy Corporation engages in coal mining business in the United States, Japan, Taiwan, Australia, India, Indonesia, China, Vietnam, South Korea, and internationally. The company supplies coal primarily to electricity generators, industrial facilities, and steel manufacturers. As of December 31, 2021, it owned interests in 17 coal mining operations located in the U.S. and Australia.
Get full access to institutional-quality research tools with Blank Capital Pro.
Upgrade to ProStarting at $19.99/mo
Get full access to institutional-quality research tools with Blank Capital Pro.
Upgrade to ProStarting at $19.99/mo
Dates updated upon official exchange announcement.
Get full access to institutional-quality research tools with Blank Capital Pro.
Upgrade to ProStarting at $19.99/mo
Get full access to institutional-quality research tools with Blank Capital Pro.
Upgrade to ProStarting at $19.99/mo
Get full access to institutional-quality research tools with Blank Capital Pro.
Upgrade to ProStarting at $19.99/mo
| Stock | Rating | Score▼ | Quality | Value | Momentum | P/E | EV/EBITDA | ROE | ROA | Gross Mgn | Op Mgn | Net Mgn | Rev Growth | Div Yield | D/E | Mkt Cap | AUDIT |
|---|---|---|---|---|---|---|---|---|---|---|---|---|---|---|---|---|---|
$VALE Vale S.A. | 75 | 88 | 93 | 67 | - | - | 15.8% | 6.9% | 36.6% | 22.8% | 15.9% | -8.9% | 0.0% | 0.0x | $38.7B | VS | |
$SU SUNCOR ENERGY INC | 74 | 87 | 90 | 53 | - | - | 13.1% | 6.5% | 58.3% | 18.4% | 11.0% | -3.6% | 4.9% | 29.0x | $46.0B | VS | |
$TRX TRX GOLD Corp | 72 | 83 | 77 | 96 | - | - | 10.7% | 6.1% | 41.5% | 27.8% | 11.4% | 40.0% | 0.0% | 2.0x | $104M | VS | |
$ORLA Orla Mining Ltd. | 72 | 94 | 83 | 78 | - | - | 19.6% | 15.7% | 74.8% | 47.5% | 26.2% | 47.2% | 0.0% | 0.0x | $1.7B | VS | |
$KGC KINROSS GOLD CORP | 71 | 83 | 89 | 79 | - | - | 15.1% | 9.3% | 37.8% | 31.6% | 20.0% | 21.3% | 1.3% | 21.0x | $11.4B | VS | |
$AEM AGNICO EAGLE MINES LTD | 71 | 80 | 80 | 71 | - | - | 9.4% | 6.5% | 60.5% | 36.0% | 22.9% | 25.0% | 2.0% | 6.0x | $38.9B | VS | |
$RIO RIO TINTO PLC | 70 | 76 | 84 | 64 | - | - | 20.3% | 11.2% | 23.0% | 20.1% | 23.1% | -1.3% | 11.2% | 26.0x | $93.8B | VS | |
$IAG IAMGOLD CORP | 70 | 71 | 82 | 89 | - | - | 29.9% | 17.1% | 33.7% | 57.8% | 51.9% | 65.4% | 0.0% | 34.0x | $2.5B | VS | |
$NGD New Gold Inc. /FI | 70 | 76 | 67 | 92 | - | - | 11.1% | 4.8% | 52.8% | 19.7% | 11.1% | 17.5% | 0.0% | 38.0x | $1.7B | VS | |
$PDS PRECISION DRILLING Corp | 70 | 77 | 90 | 65 | - | - | 6.6% | 3.6% | 34.4% | 11.0% | 5.9% | -10.0% | 0.0% | 52.0x | $876M | VS | |
$BTU PEABODY ENERGY CORP | 52 | 54 | 30 | 67 | 72.0x | 126.6x | 1.6% | 1.0% | 100.0% | 0.5% | 1.2% | -2.9% | 1.1% | 62.0x | $3.2B | ||
| SECTOR BENCH | - | - | - | - | - | 13.7x | 5.2x | 4.0% | 3.9% | 43.2% | 12.2% | 6.2% | 2.6% | 0.0% | 0.3x | - | REF |
PEABODY ENERGY CORP (BTU) receives a "Hold" rating with a composite score of 51.6/100. It ranks #1768 out of 7,333 stocks in our coverage universe and carries a 3-star rating. Ratings are driven by a 6-factor quantitative model measuring quality, value, momentum, investment, stability, and short interest.
Sign in to join the discussion.
YOY expansion rate
Core pricing power
Operating efficiency
Bottom-line conversion
Equity capital efficiency
Asset base utilization
Financial leverage load
Direct cash return
James C. Grech
Chief Executive Officer
Labor Force
5,500
54
47
44
Audit Verdict: Lower quality and stability scores may indicate governance concerns.
No recent insider transactions available for BTU
Outperforming peers — winners tend to keep winning over 3-12 months
Expensive relative to fundamentals — limited margin of safety
Average quality profile
Average volatility — neutral timing signal
Moderate investment profile
Mid-range overall rating
Get full access to institutional-quality research tools with Blank Capital Pro.
Upgrade to ProStarting at $19.99/mo
Relative valuation derived from Mining sector benchmarks. Model weights: EV/EBITDA (40%), P/B (35%), P/S (25%). Re-calculated daily.
Projection based on user-defined inputs. Re-calculated daily against current market data.
Reverse DCF Framework — Mauboussin Methodology
Institutional-grade Reverse DCF analysis. This model identifies the growth hurdles embedded in current market prices. When implied growth is significantly lower than historical or projected rates, a margin of safety may exist. Re-audited daily.
No analyst ratings for BTU.
View All RatingsMaterial decline in asset turnover efficiency detected
High margin volatility — erratic forensic earnings quality
| Factor | Global | Sector | Tilt |
|---|---|---|---|
| PROFITABILITY | 54 | 60 | -6DRAG |
| MOMENTUM | 67 | 71 | -4NEUTRAL |
| VALUATION | 30 | 26 | +4NEUTRAL |
| INVESTMENT | 47 | 75 | -28DRAG |
| STABILITY | 44 | 40 | +4NEUTRAL |
| SHORT INT | 48 | 50 | -2NEUTRAL |
Global = full universe. Sector = relative to industry peers. Positive tilt indicates idiosyncratic strength.
ROE proxy 1.6% (sector 4.0%)
GM 100% vs sector 43%, OM 1% vs sector 12%
Capital turnover N/A
Rev growth -3%, 10yr history
Interest coverage -1.8x
Composite assessment of profitability, capital efficiency, and financial strength. Top-tier entities demonstrate sustainable cash flow generation and elite competitive moats.
Profit generated per dollar of shareholder equity
Efficiency of asset utilization
Pricing power and cost efficiency
Core business profitability
Bottom-line profitability
The Quality factor evaluates the persistence and magnitude of realized cash flows. Companies with scores >70 exhibit superior pricing power and structural financial resilience through diverse economic regimes.
Our uncertainty rating tracks the predictability of future cash flows and potential for permanent capital loss. Moderate visibility with standard industry cyclicality.
Our model assigns PEABODY ENERGY CORP a Hold rating, with a composite score of 51.6/100 and 3 out of 5 stars. Ranked #1768 of 7,333 stocks, BTU presents a mixed quantitative picture — neither compelling enough to initiate new positions nor weak enough to warrant selling. Investors already holding may consider maintaining their position while monitoring for changes in the factor profile.
With a quality score of 54/100, BTU shows adequate but unremarkable business quality. The company reports a return on equity of 1.6% (sector avg: 4.0%), gross margins of 100.0% (sector avg: 43.2%), net margins of 1.2% (sector avg: 6.2%). This suggests the company generates acceptable returns but may lack the competitive positioning or operational efficiency to stand out from peers.
With a value score of 30/100, BTU appears somewhat expensive relative to its fundamentals. Key valuation metrics include a P/E ratio of 72.04x, an EV/EBITDA of 126.62x, a P/B ratio of 1.14x. Investors paying a premium here are likely betting on above-average growth or margin expansion to justify current prices.
With an investment score of 47/100, BTU exhibits moderate growth-oriented spending. Key growth metrics include revenue growth of -2.9% vs. a sector average of 2.6% and a return on assets of 1.0% (sector: 3.9%). The company appears to be balancing growth investments with capital returns, though the pace of investment may not be enough to accelerate top-line growth meaningfully.
BTU demonstrates moderate momentum with a score of 67/100, suggesting a neutral price trend without strong directional conviction. Revenue growth stands at -2.9% year-over-year, while a beta of 1.01 reflects its sensitivity to broader market moves. Moderate momentum may indicate the stock is consolidating or transitioning between trends, warranting close monitoring of upcoming catalysts.
BTU's stability score of 44/100 signals elevated volatility and/or leverage concerns. Key stability metrics include a beta of 1.01 and a debt-to-equity ratio of 62.00x (sector avg: 0.3x). Investors should be prepared for wider-than-average price swings and consider position sizing accordingly to manage portfolio risk.
The short interest score of 48/100 for BTU suggests somewhat elevated bearish positioning by institutional traders. Specific risk factors include elevated leverage (D/E: 62.00x). With a $3.2B market cap (mid-cap), PEABODY ENERGY CORP may experience above-average volatility. Investors should consider whether the short thesis has merit or if it creates a potential short-squeeze opportunity.
BTU offers a modest dividend yield of 1.1%. While the income contribution is relatively small, even a small dividend signals management's commitment to shareholder returns and can serve as a signal of financial discipline.
PEABODY ENERGY CORP is a mid-cap company in the Mining sector, ranked #0 of 50 in its sector (100th percentile) and #1768 of 7,333 overall (76th percentile). Key comparisons include ROE of 1.6% trailing the 4.0% sector median and operating margins of 0.5% below the 12.2% sector average. This top-quartile standing reflects exceptional competitive strength relative to Mining peers.
While BTU currently exhibits a HOLD profile, superior opportunities exist within the MINING sector. Our model identifies several "Strong Buy" candidates with higher quality scores and more attractive valuations among direct industry competitors.
View Top Mining Alpha →Quant Factor Profile
Upgrade catalyst
Value (30) is the limiting factor — improvement here would lift the composite score most.
EV/EBITDA 2321% ABOVE SECTOR MEDIAN
ROE 60% BELOW SECTOR MEDIAN
Gross Margin 132% ABOVE SECTOR MEDIAN (FAVORABLE)
AUDIT DATA AS OF SEP 30, 2025 (Q2 FY2025)
We rate PEABODY ENERGY CORP (BTU) as a Hold with a composite score of 51.6/100 at a current price of $33.95. The stock presents a mixed quantitative picture — neither compelling enough to warrant new accumulation nor weak enough to justify selling for existing holders. Our factors are split, and the overall profile suggests patience is warranted.
The rating is primarily driven by strength in momentum (67th percentile) and quality (54th percentile), which together account for the majority of the composite score. Offsetting weakness in value (30th percentile) and stability (44th percentile) tempers our overall conviction. We assign a No Moat rating (33/100), Medium uncertainty, and Poor capital allocation.
Key items to watch: whether strong momentum is fundamentally supported by revenue trends; valuation compression risk if growth disappoints. Any material change in these dynamics could warrant a reassessment of our rating. The moat trend is stable, which suggests the competitive landscape is stable for now.
PEABODY ENERGY CORP holds a top-quartile position (#0 of 50) within the Mining sector, based on our composite quantitative scoring across quality, value, momentum, and stability factors. The composite score of 51.6/100 places it at rank #1768 in our full 7,333-stock universe. At $3.2B in market capitalization, PEABODY ENERGY CORP is a mid-cap player in the Mining space, which limits certain scale advantages but may allow for more agile strategic execution.
Despite positive momentum (67th percentile), revenue contraction of -3% creates a divergence between price action and fundamental trajectory. This divergence suggests either that the market is looking through near-term weakness or that technical factors are temporarily inflating the stock. Investors should assess whether the revenue decline reflects cyclical weakness or structural challenges.
The margin cascade tells an important story: gross margins of 100% (+56.8pp vs sector) narrow to operating margins of 1% (-11.7pp vs sector) and net margins of 1.2%, yielding a gross-to-net conversion rate of 1%. The significant margin erosion from gross to net suggests elevated operating expenses, high interest costs, or other structural drags that warrant monitoring.
At a current price of $33.95, PEABODY ENERGY CORP is trading at a premium to fundamental value. Our value factor score of 30/100 reflects a composite assessment across multiple valuation metrics including price-to-earnings, price-to-book, EV/EBITDA, and price-to-sales ratios relative to both sector peers and the broader market. The premium valuation implies the market is pricing in significant future growth or quality improvements that are not yet fully reflected in current fundamentals.
The stock currently trades at a P/E of 72.0x (a 425% premium to the sector median of 13.7x), EV/EBITDA of 126.6x (at a premium), P/B of 1.1x, P/S of 1.0x. The above-sector P/E multiple suggests the market is pricing in superior growth or quality, which our analysis finds only partially justified by current fundamentals.
Gross margins of 100% signal strong pricing power and brand/IP advantages — businesses with margins above 40% have historically demonstrated more resilient earnings through economic cycles.
Positive momentum (67th percentile) indicates institutional accumulation and favorable technical dynamics that tend to persist in the intermediate term.
A P/E of 72.0x leaves little room for execution misses — any earnings disappointment could trigger a sharp multiple compression.
Revenue decline of -3% signals business deterioration — declining revenues make it difficult to grow into the current valuation and often precede further negative revisions.
Thin net margins of 1.2% provide limited cushion against cost pressures, competitive pricing, or macroeconomic headwinds — even small changes in costs could swing the company to a loss.
We assign a Medium uncertainty rating to PEABODY ENERGY CORP. The stock presents a balanced risk profile: elevated valuation multiple (P/E 72.0x) that leaves limited margin for error and the combination of leverage (62% D/E) and thin margins (1.2% net) amplifies downside risk. While not risk-free, the core business fundamentals are adequate to withstand moderate economic stress, and the range of potential outcomes around our fair value estimate is manageable.
Specific risk factors that inform our assessment include: elevated valuation multiple (P/E 72.0x) that leaves limited margin for error; the combination of leverage (62% D/E) and thin margins (1.2% net) amplifies downside risk. Each of these factors independently widens the distribution of potential outcomes, and in combination they create a risk profile that demands careful position sizing. The stability factor at the 44th percentile and quality factor at the 54th percentile provide a quantitative summary of the overall risk landscape.
Key risk mitigants include: healthy gross margins of 100% provide a buffer against cost pressures. These factors partially offset the identified risks and provide downside protection in adverse scenarios. On balance, the risk-reward profile is favorable for long-term investors.
We rate PEABODY ENERGY CORP's capital allocation as Poor. Key concerns include low returns on equity (1.6%), weak asset returns (ROA 1.0%). Exemplary capital allocators generate ROE above 20% and maintain conservative leverage — PEABODY ENERGY CORP significantly underperforms these benchmarks, raising questions about management's ability to create shareholder value.
Investors should scrutinize management's reinvestment decisions and balance sheet trajectory before committing capital. Poor capital allocation often compounds over time: overlevered balance sheets limit strategic flexibility, while low returns on capital destroy shareholder value. We would need to see sustained improvement in profitability metrics and balance sheet discipline before considering an upgrade.
In summary, PEABODY ENERGY CORP receives a Hold rating with a composite score of 51.6/100 (rank #1768 of 7,333). Our quantitative framework assigns a No Moat (33/100, trend: stable), Medium uncertainty, and Poor capital allocation. The average factor score across quality, value, momentum, stability, and investment is 48/100.
Our analysis supports a neutral stance on PEABODY ENERGY CORP. While the quantitative profile is not weak enough to warrant selling, it lacks the multi-factor strength required for a buy recommendation. Existing holders should maintain positions and monitor for catalysts — either fundamental improvement or valuation compression — that would shift the risk-reward balance.
Analysis derived from Blank Capital Research quantitative terminal. For informational purposes only. No trade solicitation. Past performance not indicative of future results. Consult a qualified advisor.
We do not assign PEABODY ENERGY CORP a meaningful economic moat, scoring 33/100 on our composite assessment. Current fundamentals do not demonstrate the kind of durable competitive advantages — such as superior returns on invested capital, margin superiority, or reinvestment efficiency — that would protect the company from competitive erosion over the long term. The highest-scoring pillar, margin superiority, reached only 11.1/20.
The strongest moat sources are margin superiority (11.1/20) and financial resilience (9.8/20). GM 100% vs sector 43%, OM 1% vs sector 12%. Interest coverage -1.8x. These pillars form the core of PEABODY ENERGY CORP's competitive identity and are the primary drivers of excess returns in our framework.
Areas of relative weakness include reinvestment efficiency (0/20) and economic value creation (2.1/20). Capital turnover N/A. Improvement in these areas could meaningfully widen the moat over time, while deterioration would be an early warning of competitive erosion.
Our moat trend assessment is Stable. Multi-year ROIC and operating margin trajectories show neither meaningful improvement nor deterioration, suggesting the competitive position is steady. We expect PEABODY ENERGY CORP's moat profile to remain largely unchanged absent a material shift in return on capital or industry dynamics.
Key profit drivers include gross margins of 100% providing a solid profitability foundation, declining revenues (-3%) that pressure the earnings outlook. The margin cascade from 100% gross to 1% operating to 1.2% net reveals the company's cost structure and reinvestment intensity. Our analysis indicates that profit quality is adequate though not exceptional, with the quality factor at the 54th percentile.
The margin profile shows gross margins of 100%, operating margins of 1%, net margins of 1.2%. Return metrics include ROE of 1.6% and ROA of 1.0%. Relative to the Mining sector, gross margins are 56.8 percentage points above the sector median of 43%, and ROE of 1.6% compares to a sector median of 4.0%.
The balance sheet reflects moderate leverage with D/E of 62%, a dividend yield of 1.13%, revenue growth of -3%. The sector median D/E is 0%, putting PEABODY ENERGY CORP at higher leverage than the typical peer. Overall balance sheet health is adequate for the current business environment.
Mitsubishi UFJ Trust & Banking Corp significantly reduced its stake in Peabody Energy Corporation (NYSE:BTU) by selling 191,998 shares, now holding 56,658 shares valued at $1.50 million. Despite this, other institutional investors like State Street Corp and Sourcerock Group LLC have either increased or established new positions in the company, which continues to trade around $35.25. Peabody Energy recently reported an earnings miss but maintains a "Moderate Buy" consensus rating with an average target price of $32.25.
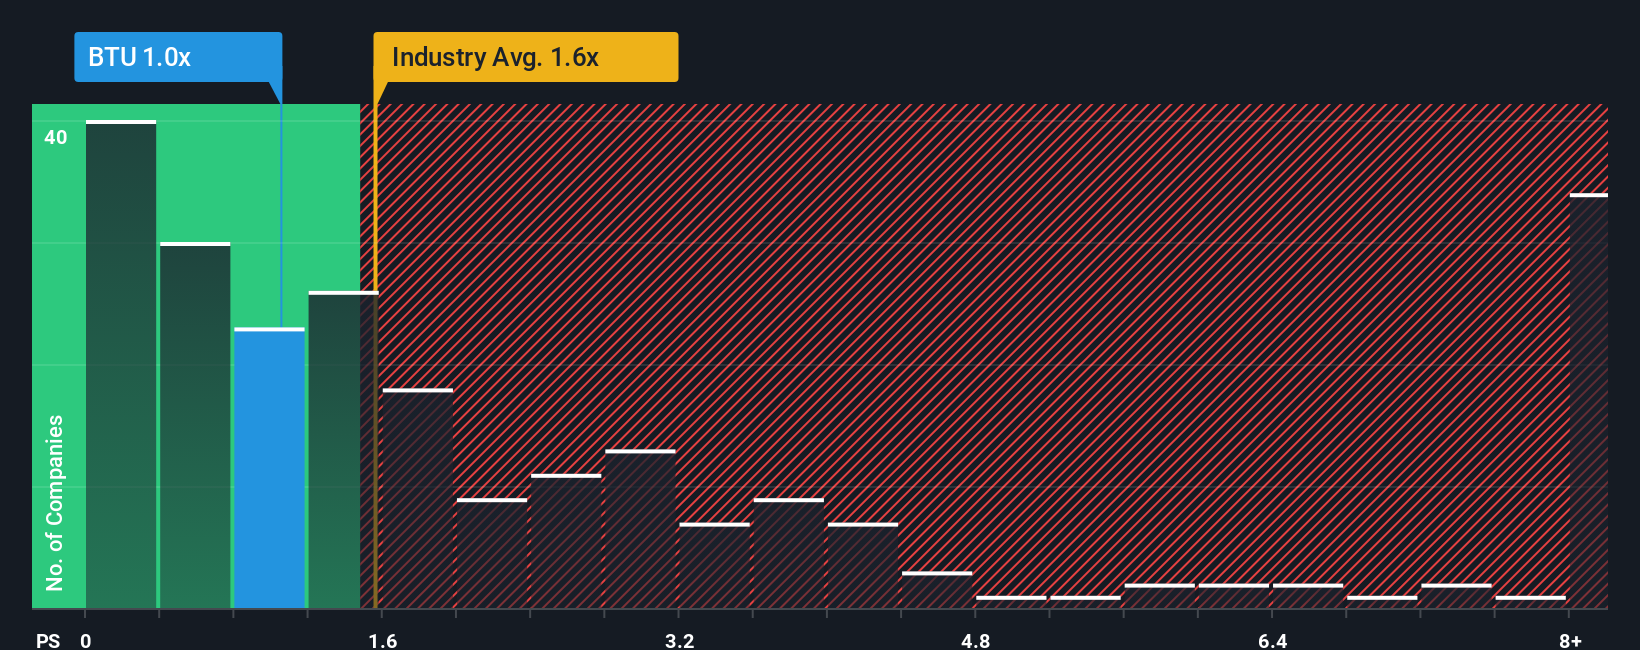
Peabody Energy Corporation (NYSE:BTU) recently saw its stock jump 28% in a month and 93% over the last year, yet its Price-to-Sales (P/S) ratio remains similar to the industry average, suggesting investors may be overlooking its potential. Despite recent revenue declines, analysts predict a strong 12% revenue growth for the company in the next year, significantly outpacing the industry's 3.1% forecast. However, the article suggests that investor uncertainty regarding the sustainability of this growth might be keeping the P/S ratio from reflecting the positive outlook.
Peabody Energy Corp released its Q3 2025 Form 10-Q, reporting a decline in revenue to $1,012.1 million and an operating loss of $(81.4) million, primarily due to lower sales volumes, pricing, and costs from a terminated acquisition. The company detailed performance across its Seaborne Thermal, Seaborne Metallurgical, Powder River Basin, and Other U.S. Thermal segments, highlighting market dynamics and progress on its Centurion Mine development.

Peabody Energy Corporation updated its bylaws, introducing new requirements for director nominations and clarifying procedures for stockholder meetings. These changes include nominees being available for interviews and specifying rules for submitting proposals at special meetings. The article also mentions recent news regarding Peabody Energy, including the termination of an acquisition and updated analyst ratings.

Riley has reiterated its 'Buy' rating for Peabody Energy Corporation (BTU) and increased its price target from $18 to $24. This adjustment came despite the termination of Peabody's purchase agreements with Anglo American, reflecting the company's strong standalone profit potential and robust thermal coal sector supported by domestic demand. Peabody's diverse coal portfolio positions it well to capitalize on market opportunities.
Above 50MA
37.18%
Net New Highs
+51081