Equity Research Analysis: Newegg Commerce, Inc. (NEGG)
|Blank Capital Research Unit|Spot: $49.46
Price$49.46
Composite Score43.2/100
RatingREDUCE (2★)
Rank#3092 OF 7,333
Market Cap$151M
IMPORTANT DISCLAIMER: Blank Capital Research ("BCR") is a technology platform, not a registered investment advisor or broker-dealer. The algorithmically generated signals, scores, and rankings provided on this site ("God Mode" Signals) are for informational and research purposes only and do not constitute financial advice, investment recommendations, or an offer to sell or solicit an offer to buy any securities.
HYPOTHETICAL PERFORMANCE RESULTS: The "timing scores" and "regime signals" displayed are based on quantitative models. Hypothetical or simulated performance results have certain inherent limitations. Unlike an actual performance record, simulated results do not represent actual trading. Also, since the trades have not actually been executed, the results may have under-or-over compensated for the impact, if any, of certain market factors, such as lack of liquidity.
RISK OF LOSS: Trading in financial markets involves a high degree of risk and may result in the loss of your entire investment. Data provided by third-party sources (Intrinio, Snowflake) is believed to be reliable but is not guaranteed for accuracy or completeness. Past performance is not indicative of future results.
© 2026 Blank Capital Research. All rights reserved. System Version: Aegis V8 (God Mode).
Verdict
Quantitative factor alignment verified for current market regime.
Quant Score
Rank
#3092
Positioning
Market Dominance
Retail Trade
Retail
$151M
Anthony Chow
Newegg Commerce, Inc. operates as an electronics-focused e-retailer in North America. The company offers desktops, laptops, gaming laptops, peripherals, and accessories. It also provides display and printing, office technology furniture, office supplies, and mailing and inventory supplies.
Get full access to institutional-quality research tools with Blank Capital Pro.
Upgrade to ProStarting at $19.99/mo
Get full access to institutional-quality research tools with Blank Capital Pro.
Upgrade to ProStarting at $19.99/mo
Get full access to institutional-quality research tools with Blank Capital Pro.
Upgrade to ProStarting at $19.99/mo
Get full access to institutional-quality research tools with Blank Capital Pro.
Upgrade to ProStarting at $19.99/mo
Get full access to institutional-quality research tools with Blank Capital Pro.
Upgrade to ProStarting at $19.99/mo
X-AXIS: EV/EBITDA (LOWER = CHEAPER) | Y-AXIS: ROE (HIGHER = ELITE) | RED CIRCLE = NEGG ANALYSIS TARGET
| Stock | Rating | Score▼ | Quality | Value | Momentum | P/E | EV/EBITDA | ROE | ROA | Gross Mgn | Op Mgn | Net Mgn | Rev Growth | Div Yield | D/E | Mkt Cap | AUDIT |
|---|---|---|---|---|---|---|---|---|---|---|---|---|---|---|---|---|---|
$ARCO Arcos Dorados Holdings Inc. | 73 | 85 | 89 | 65 | - | - | 29.1% | 5.1% | 46.8% | 7.3% | 3.3% | 3.2% | 3.4% | 153.0x | $1.5B | VS | |
$IMKTA INGLES MARKETS INC | 70 | 73 | 89 | 76 | 11.3x | 4.1x | 5.3% | 3.3% | 23.9% | 2.2% | 1.6% | -5.4% | 1.0% | 32.0x | $1.3B | VS | |
$SGU STAR GROUP, L.P. | 69 | 82 | 79 | 63 | - | - | 26.2% | 7.8% | 31.5% | 6.4% | 4.1% | 1.0% | 6.1% | 63.0x | $399M | VS | |
$EZPW EZCORP INC | 68 | 77 | 82 | 89 | 7.2x | 4.2x | 12.0% | 6.4% | 58.6% | 11.7% | 8.6% | 9.7% | 0.0% | 51.0x | $1.2B | VS | |
$HTHT H World Group Ltd | 68 | 91 | 44 | 84 | - | - | 24.9% | 4.9% | 100.0% | 21.8% | 13.0% | 6.2% | 2.9% | 45.0x | $101.1B | VS | |
$DDL Dingdong (Cayman) Ltd | 68 | 86 | 82 | 57 | - | - | 42.4% | 4.0% | 100.0% | 0.9% | 1.3% | 12.3% | 0.0% | 201.0x | $1.2B | VS | |
$SBH Sally Beauty Holdings, Inc. | 68 | 83 | 92 | 77 | 5.1x | 2.3x | 27.5% | 6.9% | 51.6% | 8.9% | 5.3% | -0.4% | 0.0% | 177.0x | $1.6B | VS | |
$SPH SUBURBAN PROPANE PARTNERS LP | 67 | 80 | 90 | 53 | - | 13.0x | 18.6% | 4.7% | 60.7% | 14.4% | 7.4% | 7.9% | 7.1% | 202.0x | $1.2B | VS | |
$IHG INTERCONTINENTAL HOTELS GROUP PLC /NEW/ | 67 | 63 | 81 | 67 | - | - | -29.5% | 13.1% | 58.6% | 40.7% | 27.4% | 6.8% | 1.3% | - | $21.5B | VS | |
$ROST ROSS STORES, INC. | 67 | 63 | 55 | 83 | 25.2x | 16.5x | 34.8% | 13.3% | 28.0% | 11.6% | 9.1% | 10.4% | 1.0% | 26.0x | $51.6B | VS | |
$NEGG Newegg Commerce, Inc. | 43 | 44 | 8 | 52 | - | - | -163.4% | -42.5% | 10.6% | -4.2% | -3.5% | -17.5% | 0.0% | 57.0x | $151M | ||
| SECTOR BENCH | - | - | - | - | - | 21.4x | 9.1x | 8.9% | 2.9% | 36.2% | 3.9% | 1.6% | 3.8% | 0.0% | 0.6x | - | REF |
Newegg Commerce, Inc. (NEGG) receives a "Reduce" rating with a composite score of 43.2/100. It ranks #3092 out of 7,333 stocks in our coverage universe and carries a 2-star rating. Ratings are driven by a 6-factor quantitative model measuring quality, value, momentum, investment, stability, and short interest.
Sign in to join the discussion.
YOY expansion rate
Core pricing power
Operating efficiency
Bottom-line conversion
Equity capital efficiency
Asset base utilization
Financial leverage load
Direct cash return
Anthony Chow
Chief Executive Officer
Labor Force
2,200
44
59
29
Audit Verdict: Lower quality and stability scores may indicate governance concerns.
No recent insider transactions available for NEGG
In-line with peers — no strong momentum signal
Expensive relative to fundamentals — limited margin of safety
Average quality profile
High volatility — wider range of outcomes increases timing risk
Moderate investment profile
Mid-range overall rating
Get full access to institutional-quality research tools with Blank Capital Pro.
Upgrade to ProStarting at $19.99/mo
Relative valuation derived from Retail Trade sector benchmarks. Model weights: EV/EBITDA (40%), P/B (35%), P/S (25%). Re-calculated daily.
No analyst ratings for NEGG.
View All RatingsImproving capital utilization rates confirmed
High margin volatility — erratic forensic earnings quality
| Factor | Global | Sector | Tilt |
|---|---|---|---|
| PROFITABILITY | 44 | 38 | +6ALPHA |
| MOMENTUM | 52 | 53 | -1NEUTRAL |
| VALUATION | 8 | 4 | +4NEUTRAL |
| INVESTMENT | 59 | 98 | -39DRAG |
| STABILITY | 29 | 22 | +7ALPHA |
| SHORT INT | 64 | 75 | -11DRAG |
Global = full universe. Sector = relative to industry peers. Positive tilt indicates idiosyncratic strength.
ROE proxy -163.4% (sector 8.9%)
GM 11% vs sector 36%, OM -4% vs sector 4%
Capital turnover N/A
Rev growth -17%, 8yr history
Interest coverage -54.2x
Composite assessment of profitability, capital efficiency, and financial strength. Top-tier entities demonstrate sustainable cash flow generation and elite competitive moats.
Profit generated per dollar of shareholder equity
Efficiency of asset utilization
Pricing power and cost efficiency
Core business profitability
Bottom-line profitability
The Quality factor evaluates the persistence and magnitude of realized cash flows. Companies with scores >70 exhibit superior pricing power and structural financial resilience through diverse economic regimes.
Our uncertainty rating tracks the predictability of future cash flows and potential for permanent capital loss. Moderate visibility with standard industry cyclicality.
Newegg Commerce, Inc. receives a Reduce rating from our analysis, with a composite score of 43.2/100 and 2 out of 5 stars, ranking #3092 out of 7,333 stocks. NEGG's factor profile shows weakness across multiple dimensions, suggesting the stock may underperform going forward. Existing holders may want to consider trimming positions or tightening stop-losses.
NEGG's quality score of 44/100 is below average, suggesting challenges with profitability or capital efficiency. The company reports a return on equity of -163.4% (sector avg: 8.9%), gross margins of 10.6% (sector avg: 36.2%), net margins of -3.5% (sector avg: 1.6%). Investors should examine whether management is actively addressing these weaknesses or if they reflect structural industry headwinds.
NEGG registers a value score of just 8/100, suggesting the stock trades at a significant premium to its fundamental metrics. Key valuation metrics include a P/B ratio of 10.05x. High-premium valuations like this require strong future execution to avoid multiple compression, and downside risk is elevated if growth disappoints.
With an investment score of 59/100, NEGG exhibits moderate growth-oriented spending. Key growth metrics include revenue growth of -17.5% vs. a sector average of 3.8% and a return on assets of -42.5% (sector: 2.9%). The company appears to be balancing growth investments with capital returns, though the pace of investment may not be enough to accelerate top-line growth meaningfully.
NEGG demonstrates moderate momentum with a score of 52/100, suggesting a neutral price trend without strong directional conviction. Revenue growth stands at -17.5% year-over-year, while a beta of -0.05 reflects its sensitivity to broader market moves. Moderate momentum may indicate the stock is consolidating or transitioning between trends, warranting close monitoring of upcoming catalysts.
NEGG's stability score of 29/100 signals elevated volatility and/or leverage concerns. Key stability metrics include a beta of -0.05 and a debt-to-equity ratio of 57.00x (sector avg: 0.6x). Investors should be prepared for wider-than-average price swings and consider position sizing accordingly to manage portfolio risk.
NEGG carries a short interest score of 64/100, indicating moderate short selling activity. This is a neutral reading — not enough to signal systemic bearishness, but worth monitoring. Specific risk factors include elevated leverage (D/E: 57.00x), micro-cap liquidity risk. At $151M market cap (micro-cap), Newegg Commerce, Inc. offers reasonable institutional liquidity.
Newegg Commerce, Inc. is a micro-cap company in the Retail Trade sector, ranked #0 of 50 in its sector (100th percentile) and #3092 of 7,333 overall (58th percentile). Key comparisons include ROE of -163.4% trailing the 8.9% sector median and operating margins of -4.2% below the 3.9% sector average. This top-quartile standing reflects exceptional competitive strength relative to Retail Trade peers.
While NEGG currently exhibits a REDUCE profile, superior opportunities exist within the RETAIL TRADE sector. Our model identifies several "Strong Buy" candidates with higher quality scores and more attractive valuations among direct industry competitors.
View Top Retail Trade Alpha →Quant Factor Profile
Upgrade catalyst
Improvement in Value (8) would have the largest impact on the composite score.
ROE 1934% BELOW SECTOR MEDIAN
Gross Margin 71% BELOW SECTOR MEDIAN
Op. Margin 207% BELOW SECTOR MEDIAN
AUDIT DATA AS OF DEC 31, 2024 (Q3 FY2024)
We rate Newegg Commerce, Inc. (NEGG) as a Reduce with a composite score of 43.2/100 at a current price of $49.46. The quantitative profile shows weakness across multiple dimensions, suggesting limited upside potential and elevated risk of underperformance relative to peers over the next 12 months.
The rating is primarily driven by strength in investment (59th percentile) and momentum (52th percentile), which together account for the majority of the composite score. Offsetting weakness in value (8th percentile) and stability (29th percentile) tempers our overall conviction. We assign a No Moat rating (13/100), High uncertainty, and Poor capital allocation.
Key items to watch: the path to profitability; valuation compression risk if growth disappoints. Any material change in these dynamics could warrant a reassessment of our rating. The moat trend is widening, which provides additional comfort in the durability of the competitive position.
Newegg Commerce, Inc. holds a top-quartile position (#0 of 50) within the Retail Trade sector, based on our composite quantitative scoring across quality, value, momentum, and stability factors. The composite score of 43.2/100 places it at rank #3092 in our full 7,333-stock universe. At $151M in market capitalization, Newegg Commerce, Inc. is a small-cap player in the Retail Trade space, which limits certain scale advantages but may allow for more agile strategic execution.
Revenue contraction of -17% combined with momentum at the 52th percentile paints a cautious picture of the near-term business outlook. The market appears to be pricing in continued challenges, and a catalyst for reversal is not clearly visible from current data.
The margin cascade tells an important story: gross margins of 11% (-25.5pp vs sector) narrow to operating margins of -4% (-8.1pp vs sector) and net margins of -3.5%, yielding a gross-to-net conversion rate of -33%. The significant margin erosion from gross to net suggests elevated operating expenses, high interest costs, or other structural drags that warrant monitoring.
At a current price of $49.46, Newegg Commerce, Inc. is trading at a premium to fundamental value. Our value factor score of 8/100 reflects a composite assessment across multiple valuation metrics including price-to-earnings, price-to-book, EV/EBITDA, and price-to-sales ratios relative to both sector peers and the broader market. The premium valuation implies the market is pricing in significant future growth or quality improvements that are not yet fully reflected in current fundamentals.
The stock currently trades at P/B of 10.1x, P/S of 0.2x. We evaluate these multiples in the context of both absolute levels and sector-relative positioning to form our valuation view.
The stock may offer contrarian value if near-term headwinds prove transitory — the current weakness in factor scores may reverse if business fundamentals stabilize.
The Reduce rating (composite 43.2/100) reflects multi-factor weakness, and historically, stocks in this scoring range have underperformed the market by a meaningful margin.
Revenue decline of -17% signals business deterioration — declining revenues make it difficult to grow into the current valuation and often precede further negative revisions.
Thin net margins of -3.5% provide limited cushion against cost pressures, competitive pricing, or macroeconomic headwinds — even small changes in costs could swing the company to a loss.
We assign a High uncertainty rating to Newegg Commerce, Inc.. Key risk factors include current negative profitability (net margin -3.5%), below-average price stability (29th percentile), low beta of -0.05 — while defensive, this may indicate limited upside participation in bull markets. The wide range of potential outcomes widens our fair value estimate and increases the possibility of permanent capital impairment. Investors considering this name should size positions accordingly and demand a meaningful margin of safety before initiating.
Specific risk factors that inform our assessment include: current negative profitability (net margin -3.5%); below-average price stability (29th percentile); low beta of -0.05 — while defensive, this may indicate limited upside participation in bull markets; the combination of leverage (57% D/E) and thin margins (-3.5% net) amplifies downside risk. Each of these factors independently widens the distribution of potential outcomes, and in combination they create a risk profile that demands careful position sizing. The stability factor at the 29th percentile and quality factor at the 44th percentile provide a quantitative summary of the overall risk landscape.
We identify limited risk mitigants at this time, which contributes to our high uncertainty assessment. Investors should monitor for improvement in balance sheet metrics, margin stability, and business predictability that could warrant a downgrade in our risk assessment over time.
We rate Newegg Commerce, Inc.'s capital allocation as Poor. Key concerns include low returns on equity (-163.4%), negative profitability, weak asset returns (ROA -42.5%). Exemplary capital allocators generate ROE above 20% and maintain conservative leverage — Newegg Commerce, Inc. significantly underperforms these benchmarks, raising questions about management's ability to create shareholder value.
Investors should scrutinize management's reinvestment decisions and balance sheet trajectory before committing capital. Poor capital allocation often compounds over time: overlevered balance sheets limit strategic flexibility, while low returns on capital destroy shareholder value. We would need to see sustained improvement in profitability metrics and balance sheet discipline before considering an upgrade.
In summary, Newegg Commerce, Inc. receives a Reduce rating with a composite score of 43.2/100 (rank #3092 of 7,333). Our quantitative framework assigns a No Moat (13/100, trend: widening), High uncertainty, and Poor capital allocation. The average factor score across quality, value, momentum, stability, and investment is 38/100.
Our analysis does not support a constructive view on Newegg Commerce, Inc. at this time. The combination of limited competitive advantages, high uncertainty, and poor capital allocation suggests unfavorable risk-reward at current levels. We recommend investors avoid new positions and existing holders consider reducing exposure.
Analysis derived from Blank Capital Research quantitative terminal. For informational purposes only. No trade solicitation. Past performance not indicative of future results. Consult a qualified advisor.
We do not assign Newegg Commerce, Inc. a meaningful economic moat, scoring 13/100 on our composite assessment. Current fundamentals do not demonstrate the kind of durable competitive advantages — such as superior returns on invested capital, margin superiority, or reinvestment efficiency — that would protect the company from competitive erosion over the long term. The highest-scoring pillar, financial resilience, reached only 7/20.
The strongest moat sources are financial resilience (7/20) and growth durability (3.5/20). Interest coverage -54.2x. Rev growth -17%, 8yr history. These pillars form the core of Newegg Commerce, Inc.'s competitive identity and are the primary drivers of excess returns in our framework.
Areas of relative weakness include economic value creation (0/20) and reinvestment efficiency (0/20). ROE proxy -163.4% (sector 8.9%). Improvement in these areas could meaningfully widen the moat over time, while deterioration would be an early warning of competitive erosion.
Our moat trend assessment is Widening. ROIC has trended upward at ~10.6pp per year, and operating margin trajectory confirms strengthening economics. Newegg Commerce, Inc.'s competitive position is improving on a fundamental basis. We expect the moat score to drift upward if these trends persist over the next 12–18 months.
Key profit drivers include declining revenues (-17%) that pressure the earnings outlook. The margin cascade from 11% gross to -4% operating to -3.5% net reveals the company's cost structure and reinvestment intensity. Our analysis indicates that profit quality is adequate though not exceptional, with the quality factor at the 44th percentile.
The margin profile shows gross margins of 11%, operating margins of -4%, net margins of -3.5%. Return metrics include ROE of -163.4% and ROA of -42.5%. Relative to the Retail Trade sector, gross margins are 25.5 percentage points below the sector median of 36%, and ROE of -163.4% compares to a sector median of 8.9%.
The balance sheet reflects moderate leverage with D/E of 57%, revenue growth of -17%. The sector median D/E is 1%, putting Newegg Commerce, Inc. at higher leverage than the typical peer. Overall balance sheet health is adequate for the current business environment.
Above 50MA
37.18%
Net New Highs
+51081
Newegg Commerce Inc. (NASDAQ:NEGG) recently experienced a 29% share price drop over 30 days, although its annual performance is still up 488%. Despite this plunge, its P/S ratio of 0.9x is considered "middle-of-the-road" compared to the Specialty Retail industry median of 0.5x, suggesting potential investor oversight or setback. The company's revenue has declined by 5.7% in the last year and 36% over three years, contrasting sharply with the industry's expected 8.0% growth, raising concerns about the sustainability of its current P/S ratio.
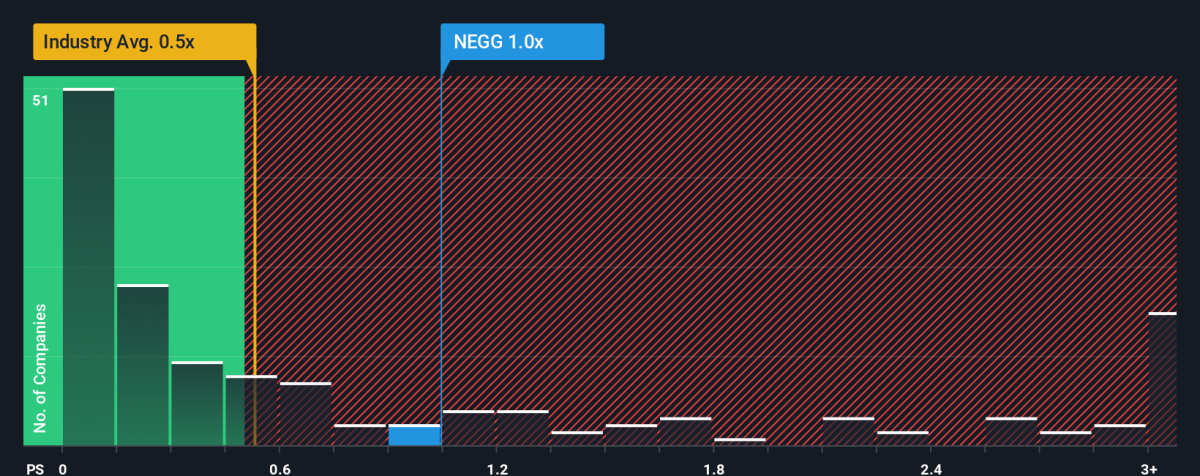
Newegg Commerce, Inc.'s stock has recently fallen 28%, yet its Price-to-Sales (P/S) ratio of 1x remains elevated compared to the Specialty Retail industry average of 0.5x. This high P/S is despite a 5.7% revenue decline over the last year and a 36% drop over three years, contrasting with the industry's expected 8.0% growth. The article suggests that investors might be ignoring the negative growth trends, which could lead to future disappointment if the P/S ratio adjusts to reflect the company's performance.
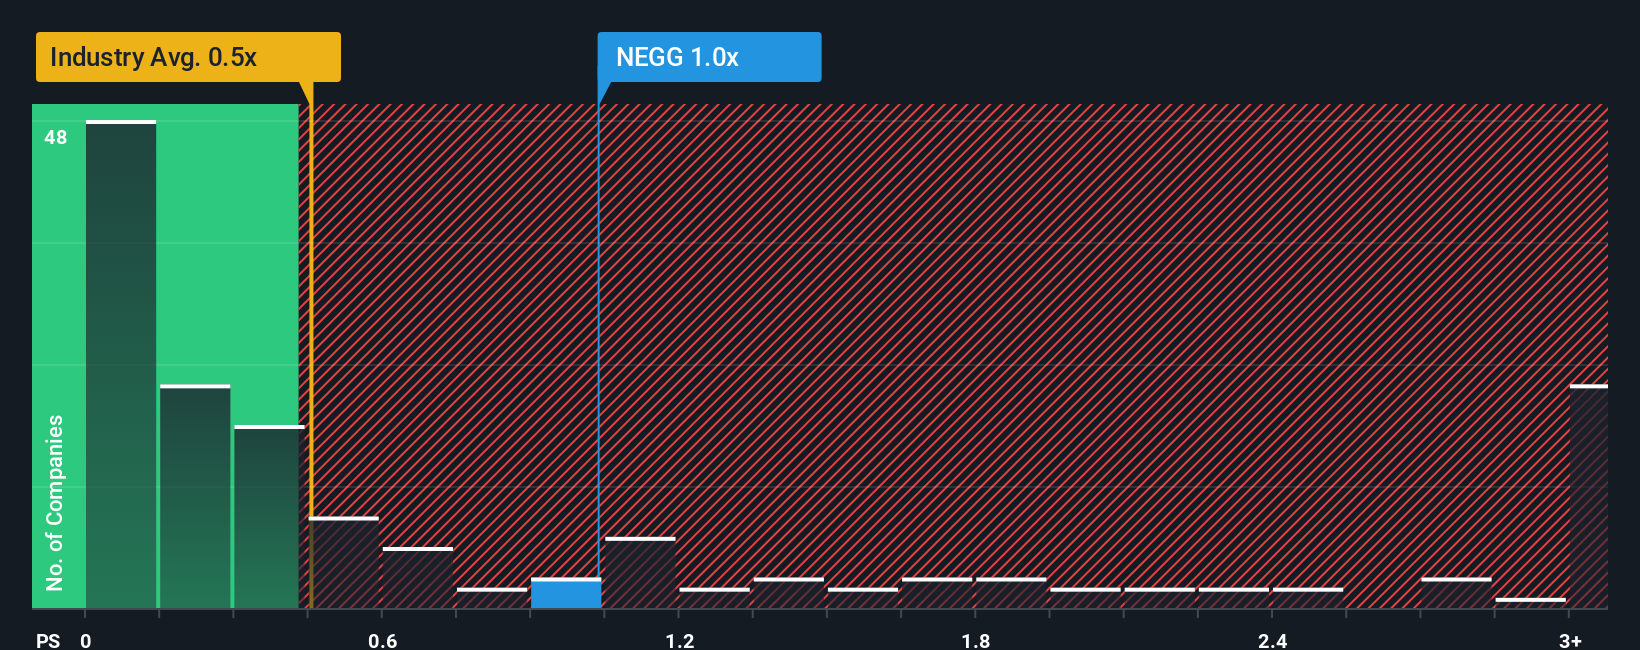
Newegg Commerce, Inc. (NASDAQ:NEGG) recently experienced a 54% share price surge, contributing to a 395% gain over the last twelve months. Despite this, the company's price-to-sales (P/S) ratio of 1x is notably higher than the industry average, which is problematic given its declining revenue over the past year and three years. The article suggests that this high P/S ratio might not be justified by the company's recent performance, potentially indicating overvaluation if revenue trends persist.
In the last year, multiple insiders have substantially increased their holdings of Newegg Commerce, Inc. ( NASDAQ:NEGG...
Newegg Commerce, Inc. announced the appointment of Brian Burns Jr. to its Board of Directors, effective February 2, 2026. Burns, nominated by significant shareholder Vladimir Galkin, replaces Yingmei Yang. Newegg emphasized Burns's experience in consumer electronics, finance, and investment management and stated Yang's departure was not due to any disagreement with the company.