Equity Research Analysis: GENESCO INC (GCO)
|Blank Capital Research Unit|Spot: $26.53
Price$26.53
Composite Score54.9/100
RatingHOLD (3★)
Rank#1283 OF 7,333
Market Cap$313M
P/E Ratio
IMPORTANT DISCLAIMER: Blank Capital Research ("BCR") is a technology platform, not a registered investment advisor or broker-dealer. The algorithmically generated signals, scores, and rankings provided on this site ("God Mode" Signals) are for informational and research purposes only and do not constitute financial advice, investment recommendations, or an offer to sell or solicit an offer to buy any securities.
HYPOTHETICAL PERFORMANCE RESULTS: The "timing scores" and "regime signals" displayed are based on quantitative models. Hypothetical or simulated performance results have certain inherent limitations. Unlike an actual performance record, simulated results do not represent actual trading. Also, since the trades have not actually been executed, the results may have under-or-over compensated for the impact, if any, of certain market factors, such as lack of liquidity.
RISK OF LOSS: Trading in financial markets involves a high degree of risk and may result in the loss of your entire investment. Data provided by third-party sources (Intrinio, Snowflake) is believed to be reliable but is not guaranteed for accuracy or completeness. Past performance is not indicative of future results.
© 2026 Blank Capital Research. All rights reserved. System Version: Aegis V8 (God Mode).
Verdict
Quantitative factor alignment verified for current market regime.
Quant Score
Rank
#1283
Positioning
Market Dominance
Retail Trade
Retail
$313M
Mimi E. Vaughn
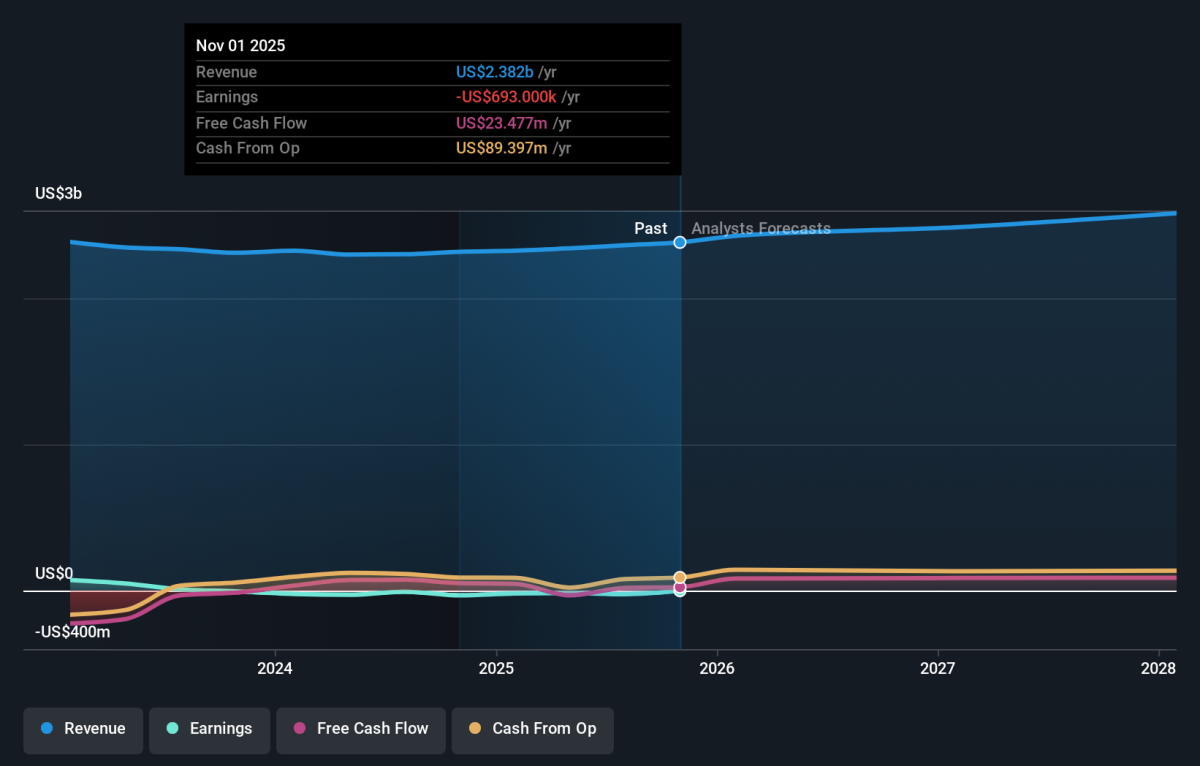
Genesco Inc. operates through four segments: Journeys Group, Schuh Group, Johnston & Murphy Group, and Licensed Brands. As of January 29, 2022, the company operated approximately 1,425 retail stores in the United States, Puerto Rico, Canada, the United Kingdom, and Republic of Ireland.
Headcount
18.0K
Get full access to institutional-quality research tools with Blank Capital Pro.
Upgrade to ProStarting at $19.99/mo
Get full access to institutional-quality research tools with Blank Capital Pro.
Upgrade to ProStarting at $19.99/mo
Get full access to institutional-quality research tools with Blank Capital Pro.
Upgrade to ProStarting at $19.99/mo
Get full access to institutional-quality research tools with Blank Capital Pro.
Upgrade to ProStarting at $19.99/mo
Get full access to institutional-quality research tools with Blank Capital Pro.
Upgrade to ProStarting at $19.99/mo
X-AXIS: EV/EBITDA (LOWER = CHEAPER) | Y-AXIS: ROE (HIGHER = ELITE) | RED CIRCLE = GCO ANALYSIS TARGET
| Stock | Rating | Score▼ | Quality | Value | Momentum | P/E | EV/EBITDA | ROE | ROA | Gross Mgn | Op Mgn | Net Mgn | Rev Growth | Div Yield | D/E | Mkt Cap | AUDIT |
|---|---|---|---|---|---|---|---|---|---|---|---|---|---|---|---|---|---|
$ARCO Arcos Dorados Holdings Inc. | 73 | 85 | 89 | 65 | - | - | - | - | - | - | - | - | - | - | $0 | VS | |
$IMKTA INGLES MARKETS INC | 70 | 73 | 89 | 76 | 11.3x | 4.1x | 6.9% | 4.1% | 24.3% | 2.8% | 1.9% | -3.4% | 1.1% | 33.0x | $1.2B | VS | |
$SGU STAR GROUP, L.P. | 69 | 82 | 79 | 63 | - | - | -25.2% | -10.6% | 28.1% | -6.3% | -5.4% | -7.8% | 6.1% | 57.0x | $396M | VS | |
$EZPW EZCORP INC | 68 | 77 | 82 | 89 | 7.2x | 4.2x | 12.0% | 6.2% | 59.1% | 11.6% | 8.5% | 10.5% | 0.0% | 52.0x | $764M | VS | |
$HTHT H World Group Ltd | 68 | 91 | 44 | 84 | - | - | - | - | - | - | - | - | - | - | $0 | VS | |
$DDL Dingdong (Cayman) Ltd | 68 | 86 | 82 | 57 | - | - | - | - | - | - | - | - | - | - | $0 | VS | |
$SBH Sally Beauty Holdings, Inc. | 68 | 83 | 92 | 77 | 5.1x | 2.3x | 32.0% | 6.6% | 51.5% | 8.4% | 4.9% | -1.0% | 0.0% | 178.0x | $934M | VS | |
$SPH SUBURBAN PROPANE PARTNERS LP | 67 | 80 | 90 | 53 | - | 13.0x | 0.4% | -3.5% | 61.7% | 2.1% | -5.7% | 2.2% | 7.1% | 190.0x | $1.2B | VS | |
$IHG INTERCONTINENTAL HOTELS GROUP PLC /NEW/ | 67 | 63 | 81 | 67 | - | - | - | - | - | - | - | - | - | - | $0 | VS | |
$ROST ROSS STORES, INC. | 67 | 63 | 55 | 83 | 25.2x | 16.5x | 34.8% | 13.3% | 28.0% | 11.6% | 9.1% | 10.4% | 1.0% | 26.0x | $51.6B | VS | |
$GCO GENESCO INC | 55 | 55 | 80 | 45 | 50.7x | 4.3x | -5.6% | -2.0% | 46.5% | -1.5% | -1.5% | 17.3% | 0.0% | 17.0x | $313M | ||
| SECTOR BENCH | - | - | - | - | - | 21.4x | 9.1x | 9.6% | 3.6% | 37.3% | 4.4% | 2.4% | 3.7% | 0.0% | 0.7x | - | REF |
GENESCO INC (GCO) receives a "Hold" rating with a composite score of 54.9/100. It ranks #1283 out of 7,333 stocks in our coverage universe and carries a 3-star rating. Ratings are driven by a 6-factor quantitative model measuring quality, value, momentum, investment, stability, and short interest.
Sign in to join the discussion.
HQ Base
Nashville, Tennessee
In-line with peers — no strong momentum signal
Trading at a discount to fundamentals — favorable entry valuation
Average quality profile
High volatility — wider range of outcomes increases timing risk
Moderate investment profile
Mid-range overall rating
Get full access to institutional-quality research tools with Blank Capital Pro.
Upgrade to ProStarting at $19.99/mo
Relative valuation derived from Retail Trade sector benchmarks. Model weights: EV/EBITDA (40%), P/B (35%), P/S (25%). Re-calculated daily.
Projection based on user-defined inputs. Re-calculated daily against current market data.
Reverse DCF Framework — Mauboussin Methodology
Institutional-grade Reverse DCF analysis. This model identifies the growth hurdles embedded in current market prices. When implied growth is significantly lower than historical or projected rates, a margin of safety may exist. Re-audited daily.
No analyst ratings for GCO.
View All Ratings| Factor | Global | Sector | Tilt |
|---|---|---|---|
| PROFITABILITY | 55 | 70 | -15DRAG |
| MOMENTUM | 45 | 42 | +3NEUTRAL |
| VALUATION | 80 | 90 | -10DRAG |
| INVESTMENT | 47 | 86 | -39DRAG |
| STABILITY | 26 | 14 | +12ALPHA |
| SHORT INT | 77 | 90 | -13DRAG |
Global = full universe. Sector = relative to industry peers. Positive tilt indicates idiosyncratic strength.
ROIC 9.9% vs WACC 7.8% (spread +2.2%)
GM 47% vs sector 37%, OM -1% vs sector 4%
Capital turnover 9.86x
Rev growth 17%, 11yr history
Interest coverage 9.7x, Net debt/EBITDA 2.9x
Composite assessment of profitability, capital efficiency, and financial strength. Top-tier entities demonstrate sustainable cash flow generation and elite competitive moats.
Profit generated per dollar of shareholder equity
Efficiency of asset utilization
Pricing power and cost efficiency
Core business profitability
Bottom-line profitability
The Quality factor evaluates the persistence and magnitude of realized cash flows. Companies with scores >70 exhibit superior pricing power and structural financial resilience through diverse economic regimes.
Our uncertainty rating tracks the predictability of future cash flows and potential for permanent capital loss. Moderate visibility with standard industry cyclicality.
We rate GENESCO INC (GCO) as a Hold with a composite score of 54.9/100 at a current price of $26.53. The stock presents a mixed quantitative picture — neither compelling enough to warrant new accumulation nor weak enough to justify selling.
GENESCO INC holds a top-quartile position (#0 of 50) within the Retail Trade sector, based on our composite quantitative scoring across quality, value, momentum, and stability factors. The composite score of 54.9/100 places it at rank #1283 in our full universe.
Narrow
Very High
Poor
Undervalued
Gross margins of 47% signal strong pricing power.
Value factor score of 80 suggests attractive pricing.
Stable competitive position in a defensive sector.
Elevated P/E ratio of 50.7x leaves little room for execution misses.
Vulnerability to macroeconomic shocks and interest rate volatility.
GENESCO INC represents a hold based on multi-factor quantitative performance.
Our model assigns GENESCO INC a Hold rating, with a composite score of 54.9/100 and 3 out of 5 stars. Ranked #1283 of 7,333 stocks, GCO presents a mixed quantitative picture — neither compelling enough to initiate new positions nor weak enough to warrant selling. Investors already holding may consider maintaining their position while monitoring for changes in the factor profile.
With a quality score of 55/100, GCO shows adequate but unremarkable business quality. The company reports a return on equity of -5.6% (sector avg: 9.6%), gross margins of 46.5% (sector avg: 37.3%), net margins of -1.5% (sector avg: 2.4%). This suggests the company generates acceptable returns but may lack the competitive positioning or operational efficiency to stand out from peers.
GCO carries a solid value score of 80/100, pointing to an attractively priced stock relative to peers. Key valuation metrics include a P/E ratio of 50.73x, an EV/EBITDA of 4.34x, a P/B ratio of 0.61x. This score suggests reasonable compensation for the risks involved, with potential upside if the market recognizes the stock's underlying worth.
With an investment score of 47/100, GCO exhibits moderate growth-oriented spending. Key growth metrics include revenue growth of 17.3% vs. a sector average of 3.7% and a return on assets of -2.0% (sector: 3.6%). The company appears to be balancing growth investments with capital returns, though the pace of investment may not be enough to accelerate top-line growth meaningfully.
GCO is currently showing below-average momentum at 45/100, which may indicate weakening institutional interest or negative sentiment shifts. Revenue growth stands at 17.3% year-over-year, while a beta of 1.91 reflects its sensitivity to broader market moves. Investors should note that declining momentum can precede further price weakness, though contrarian opportunities sometimes emerge at these levels.
GCO's stability score of 26/100 signals elevated volatility and/or leverage concerns. Key stability metrics include a beta of 1.91 and a debt-to-equity ratio of 17.00x (sector avg: 0.7x). Investors should be prepared for wider-than-average price swings and consider position sizing accordingly to manage portfolio risk.
GCO carries a short interest score of 77/100, indicating moderate short selling activity. This is a neutral reading — not enough to signal systemic bearishness, but worth monitoring. Specific risk factors include high market sensitivity (beta: 1.91), elevated leverage (D/E: 17.00x), small-cap liquidity risk. At $313M market cap (small-cap), GENESCO INC offers reasonable institutional liquidity.
GENESCO INC is a small-cap company in the Retail Trade sector, ranked #0 of 50 in its sector (100th percentile) and #1283 of 7,333 overall (83rd percentile). Key comparisons include ROE of -5.6% trailing the 9.6% sector median and operating margins of -1.5% below the 4.4% sector average. This top-quartile standing reflects exceptional competitive strength relative to Retail Trade peers.
While GCO currently exhibits a HOLD profile, superior opportunities exist within the RETAIL TRADE sector. Our model identifies several "Strong Buy" candidates with higher quality scores and more attractive valuations among direct industry competitors.
View Top Retail Trade Alpha →Quant Factor Profile
Key factor gap
Value (80) vs Stability (26) — closing this gap could shift the rating.
EV/EBITDA 52% BELOW SECTOR MEDIAN (FAVORABLE)
ROE 159% BELOW SECTOR MEDIAN
Gross Margin 25% ABOVE SECTOR MEDIAN (FAVORABLE)
Above 50MA
37.18%
Net New Highs
+51081
Genesco (NYSE:GCO) shareholders have experienced a 31% loss over the last three years, despite a recent 28% gain in the past month. The company's share price decline is attributed to investor pessimism, potentially linked to flat revenue growth over the same period, even though the company has been profitable in the past and insiders have been making purchases. Analysts expect future profit growth, suggesting a potential future turnaround for the stock.

Genesco (GCO) announced a fourth amendment to its credit agreement, extending the maturity of its revolving credit facility to January 16, 2031, while maintaining current borrowing bases and collateral. This amendment relaxes financial covenants, shifts Canadian rates to Term CORRA, removes credit spread adjustments for domestic borrowings, and revises pricing, aiming to improve funding flexibility and lower financing costs. Spark's AI Analyst gives GCO a "Neutral" rating, citing strong revenue growth and free cash flow balanced by weak profitability.

US stock futures are down ahead of the upcoming jobs report, with the Nasdaq and S&P 500 futures declining. Traders are cautious due to concerns about the economic outlook and the Federal Reserve's policy trajectory.

The CNN Money Fear and Greed index showed some improvement in the overall market sentiment, with the index moving to the "Extreme Greed" zone on Thursday. U.S. stocks closed higher on Thursday, with the S&P 500 surging to a record high level during the session. Addressing the Senate Banking Committee, Fed Chair Jerome Powell indicated that the Fed is not too far from being confident enough to cut rates, suggesting a growing inclination among policymakers to initiate easing policy this year. Kroger Company (NYSE: KR) reported better-than-expected earnings for its fourth quarter. BJ’s Wholesale Club Holdings Inc (NYSE: BJ) reported downbeat sales for its fourth quarter. On the economic data ...
NEW YORK, February 24, 2026--Establishment Labs Holdings Inc. (NASDAQ: ESTA), a global medical technology company dedicated to improving women’s health and wellness, principally in breast aesthetics and reconstruction, today announced a strategic leadership transition of Raj Denhoy, current Chief Financial Officer to Senior Vice President, Global Strategy, and the appointment of Cassandra "Sandra" Harris to Senior Vice President and Chief Financial Officer, effective March 9, 2026.