Equity Research Analysis: Apple Hospitality REIT, Inc. (APLE)
|Blank Capital Research Unit|Spot: $12.15
Price$12.15
Composite Score37.2/100
RatingAVOID (1★)
Rank#3873 OF 7,333
Market Cap$2.8B
IMPORTANT DISCLAIMER: Blank Capital Research ("BCR") is a technology platform, not a registered investment advisor or broker-dealer. The algorithmically generated signals, scores, and rankings provided on this site ("God Mode" Signals) are for informational and research purposes only and do not constitute financial advice, investment recommendations, or an offer to sell or solicit an offer to buy any securities.
HYPOTHETICAL PERFORMANCE RESULTS: The "timing scores" and "regime signals" displayed are based on quantitative models. Hypothetical or simulated performance results have certain inherent limitations. Unlike an actual performance record, simulated results do not represent actual trading. Also, since the trades have not actually been executed, the results may have under-or-over compensated for the impact, if any, of certain market factors, such as lack of liquidity.
RISK OF LOSS: Trading in financial markets involves a high degree of risk and may result in the loss of your entire investment. Data provided by third-party sources (Intrinio, Snowflake) is believed to be reliable but is not guaranteed for accuracy or completeness. Past performance is not indicative of future results.
© 2026 Blank Capital Research. All rights reserved. System Version: Aegis V8 (God Mode).
Verdict
Quantitative factor alignment verified for current market regime.
Quant Score
Rank
#3873
Positioning
Market Dominance
Finance, Insurance, And Real Estate
Trading
$2.8B
Justin G. Knight
Apple Hospitality REIT, Inc. owns one of the largest and most diverse portfolios of upscale, rooms-focused hotels in the United States. Its portfolio consists of 235 hotels with more than 30,000 guest rooms located in 87 markets throughout 34 states.
Get full access to institutional-quality research tools with Blank Capital Pro.
Upgrade to ProStarting at $19.99/mo
Get full access to institutional-quality research tools with Blank Capital Pro.
Upgrade to ProStarting at $19.99/mo
Dates updated upon official exchange announcement.
Get full access to institutional-quality research tools with Blank Capital Pro.
Upgrade to ProStarting at $19.99/mo
Get full access to institutional-quality research tools with Blank Capital Pro.
Upgrade to ProStarting at $19.99/mo
Get full access to institutional-quality research tools with Blank Capital Pro.
Upgrade to ProStarting at $19.99/mo
X-AXIS: EV/EBITDA (LOWER = CHEAPER) | Y-AXIS: ROE (HIGHER = ELITE) | RED CIRCLE = APLE ANALYSIS TARGET
| Stock | Rating | Score▼ | Quality | Value | Momentum | P/E | EV/EBITDA | ROE | ROA | Gross Mgn | Op Mgn | Net Mgn | Rev Growth | Div Yield | D/E | Mkt Cap | AUDIT |
|---|---|---|---|---|---|---|---|---|---|---|---|---|---|---|---|---|---|
$SII SPROTT INC. | 75 | 91 | 87 | 98 | - | - | 15.7% | 12.8% | 48.9% | 37.0% | 28.8% | 14.9% | 2.5% | 0.0x | $1.1B | VS | |
$PUK PRUDENTIAL PLC | 73 | 88 | 97 | 80 | - | - | 13.2% | 1.4% | 100.0% | 97.0% | 23.8% | 11.8% | 2.7% | 5.0x | $21.5B | VS | |
$NMR NOMURA HOLDINGS INC | 72 | 81 | 92 | 87 | - | - | 9.9% | 0.6% | 84.5% | 70.0% | 7.3% | 14.9% | 0.0% | 923.0x | $18.3B | VS | |
$PSLV Sprott Physical Silver Trust | 69 | 82 | 80 | 98 | - | - | 17.3% | 17.7% | 100.0% | 100.0% | 100.0% | 1643.8% | 0.0% | 0.0x | $5.0B | VS | |
$UFCS UNITED FIRE GROUP INC | 68 | 81 | 93 | 76 | 5.0x | 3.5x | 13.2% | 4.1% | 99.9% | 14.7% | 11.1% | 9.2% | 2.1% | 16.0x | $775M | VS | |
$SLF SUN LIFE FINANCIAL INC | 68 | 83 | 95 | 63 | - | - | 12.6% | 0.9% | 32.0% | 31.3% | 7.9% | -12.9% | 4.3% | 24.0x | $37.8B | VS | |
$CBOE Cboe Global Markets, Inc. | 68 | 75 | 63 | 77 | 21.3x | 15.7x | 24.0% | 13.7% | 41.7% | 32.4% | 26.4% | 8.2% | 1.1% | 30.0x | $25.7B | VS | |
$PHYS Sprott Physical Gold Trust | 67 | 64 | 82 | 91 | - | - | 22.5% | 22.8% | 101.8% | 100.0% | 100.0% | 138.9% | 0.0% | 0.0x | $8.4B | VS | |
$VTMX Vesta Real Estate Corporation, S.A.B. de C.V. | 67 | 69 | 77 | 80 | - | - | 8.8% | 5.8% | 98.7% | 75.7% | 88.5% | 17.6% | 4.3% | 34.0x | $2.2B | VS | |
$GLDM World Gold Trust | 66 | 54 | 85 | 92 | 11.3x | 11.3x | - | 27.1% | 100.0% | 98.9% | 459.9% | 333.4% | 0.0% | 0.0x | $43.7B | VS | |
$APLE Apple Hospitality REIT, Inc. | 37 | 30 | 50 | 28 | 14.5x | 9.3x | 6.3% | 4.1% | 41.0% | 19.4% | 13.6% | -4.2% | 8.5% | 47.0x | $2.8B | ||
| SECTOR BENCH | - | - | - | - | - | 11.9x | 7.8x | 8.9% | 1.2% | 76.5% | 17.0% | 21.5% | 10.8% | 1.9% | 0.5x | - | REF |
Apple Hospitality REIT, Inc. (APLE) receives a "Avoid" rating with a composite score of 37.2/100. It ranks #3873 out of 7,333 stocks in our coverage universe and carries a 1-star rating. Ratings are driven by a 6-factor quantitative model measuring quality, value, momentum, investment, stability, and short interest.
Sign in to join the discussion.
YOY expansion rate
Core pricing power
Operating efficiency
Bottom-line conversion
Equity capital efficiency
Asset base utilization
Financial leverage load
Direct cash return
Justin G. Knight
Chief Executive Officer
Labor Force
60
30
33
50
Audit Verdict: Lower quality and stability scores may indicate governance concerns.
No recent insider transactions available for APLE
Lagging peers — losers tend to keep underperforming
Fair valuation relative to peers
Weak fundamentals — higher risk of value trap
Average volatility — neutral timing signal
Aggressive spending — empire-building risk, dilutive growth
Below-average composite — caution warranted
Get full access to institutional-quality research tools with Blank Capital Pro.
Upgrade to ProStarting at $19.99/mo
Relative valuation derived from Finance, Insurance, And Real Estate sector benchmarks. Model weights: EV/EBITDA (40%), P/B (35%), P/S (25%). Re-calculated daily.
Projection based on user-defined inputs. Re-calculated daily against current market data.
Reverse DCF Framework — Mauboussin Methodology
Institutional-grade Reverse DCF analysis. This model identifies the growth hurdles embedded in current market prices. When implied growth is significantly lower than historical or projected rates, a margin of safety may exist. Re-audited daily.
No analyst ratings for APLE.
View All RatingsConservative accounting — High cash conversion efficiency
Material decline in asset turnover efficiency detected
| Factor | Global | Sector | Tilt |
|---|---|---|---|
| PROFITABILITY | 30 | 35 | -5NEUTRAL |
| MOMENTUM | 28 | 21 | +7ALPHA |
| VALUATION | 50 | 66 | -16DRAG |
| INVESTMENT | 33 | 51 | -18DRAG |
| STABILITY | 50 | 50 | 0NEUTRAL |
| SHORT INT | 13 | 1 | +12ALPHA |
Global = full universe. Sector = relative to industry peers. Positive tilt indicates idiosyncratic strength.
ROIC 5.0% vs WACC 8.1% (spread -3.2%)
GM 41% vs sector 77%, OM 19% vs sector 17%
Capital turnover 0.26x
Rev growth -4%, 10yr history
Interest coverage N/A, Net debt/EBITDA 12.1x
Composite assessment of profitability, capital efficiency, and financial strength. Top-tier entities demonstrate sustainable cash flow generation and elite competitive moats.
Profit generated per dollar of shareholder equity
Efficiency of asset utilization
Pricing power and cost efficiency
Core business profitability
Bottom-line profitability
The Quality factor evaluates the persistence and magnitude of realized cash flows. Companies with scores >70 exhibit superior pricing power and structural financial resilience through diverse economic regimes.
Our uncertainty rating tracks the predictability of future cash flows and potential for permanent capital loss. Moderate visibility with standard industry cyclicality.
Our quantitative model flags Apple Hospitality REIT, Inc. with an Avoid rating, assigning a composite score of 37.2/100 and 1 out of 5 stars. Ranked #3873 of 7,333 stocks, APLE falls in the bottom tier across key factors. Historically, stocks with this profile have faced elevated risk of underperformance and capital loss.
APLE's quality score of 30/100 is below average, suggesting challenges with profitability or capital efficiency. The company reports a return on equity of 6.3% (sector avg: 8.9%), gross margins of 41.0% (sector avg: 76.5%), net margins of 13.6% (sector avg: 21.5%). Investors should examine whether management is actively addressing these weaknesses or if they reflect structural industry headwinds.
APLE's value score of 50/100 indicates the stock is fairly valued based on its current fundamentals. Key valuation metrics include a P/E ratio of 14.46x, an EV/EBITDA of 9.26x, a P/B ratio of 0.92x. At this level, neither a clear bargain nor overpriced, the stock's attractiveness depends more on forward growth expectations and qualitative factors.
Apple Hospitality REIT, Inc.'s investment score of 33/100 suggests limited reinvestment activity. Key growth metrics include revenue growth of -4.2% vs. a sector average of 10.8% and a return on assets of 4.1% (sector: 1.2%). While this can be positive for mature, cash-generative businesses returning capital to shareholders, it may also signal a lack of growth opportunities or management conservatism.
Apple Hospitality REIT, Inc. is experiencing notably weak momentum with a score of just 28/100. The stock has underperformed its peers and is trending below major moving averages. Revenue growth stands at -4.2% year-over-year, while a beta of 1.04 reflects its sensitivity to broader market moves. While deep momentum weakness can occasionally present value opportunities, it often reflects deteriorating fundamentals or structural headwinds that may persist.
With a stability score of 50/100, APLE exhibits average financial resilience. Key stability metrics include a beta of 1.04 and a debt-to-equity ratio of 47.00x (sector avg: 0.5x). While the balance sheet is not a major concern, the stock is subject to typical market volatility and may experience sharper drawdowns during risk-off episodes.
Apple Hospitality REIT, Inc.'s short interest score of 13/100 reveals significant bearish positioning, suggesting institutional investors are actively betting against the stock. Specific risk factors include elevated leverage (D/E: 47.00x). At $2.8B (mid-cap), APLE carries meaningful risk and is best suited for investors with high risk tolerance who have thoroughly evaluated the bear thesis.
Apple Hospitality REIT, Inc. offers an attractive dividend yield of 8.5%, placing it among the higher-yielding stocks in its peer group. This compares to a sector average dividend yield of 1.9%. A yield this high can provide meaningful income, but investors should verify the payout is sustainable by examining the payout ratio, free cash flow coverage, and any history of dividend cuts.
Apple Hospitality REIT, Inc. is a mid-cap company in the Finance, Insurance, And Real Estate sector, ranked #0 of 50 in its sector (100th percentile) and #3873 of 7,333 overall (47th percentile). Key comparisons include ROE of 6.3% trailing the 8.9% sector median and operating margins of 19.4% above the 17.0% sector average. This top-quartile standing reflects exceptional competitive strength relative to Finance, Insurance, And Real Estate peers.
While APLE currently exhibits a AVOID profile, superior opportunities exist within the FINANCE, INSURANCE, AND REAL ESTATE sector. Our model identifies several "Strong Buy" candidates with higher quality scores and more attractive valuations among direct industry competitors.
View Top Finance, Insurance, And Real Estate Alpha →Quant Factor Profile
Upgrade catalyst
Improvement in Short Int. (13) would have the largest impact on the composite score.
EV/EBITDA 19% ABOVE SECTOR MEDIAN
ROE 29% BELOW SECTOR MEDIAN
Gross Margin 46% BELOW SECTOR MEDIAN
AUDIT DATA AS OF SEP 30, 2025 (Q2 FY2025)
We rate Apple Hospitality REIT, Inc. (APLE) as Avoid with a composite score of 37.2/100 at a current price of $12.15. The stock falls in the bottom quintile of our universe across key quantitative factors, and the multi-factor weakness suggests a high probability of continued underperformance.
The rating is primarily driven by strength in value (50th percentile) and stability (50th percentile), which together account for the majority of the composite score. Offsetting weakness in momentum (28th percentile) and quality (30th percentile) tempers our overall conviction. We assign a No Moat rating (23/100), Medium uncertainty, and Standard capital allocation.
Key items to watch: momentum to confirm whether the current price trend has legs. Any material change in these dynamics could warrant a reassessment of our rating. The moat trend is stable, which suggests the competitive landscape is stable for now.
Apple Hospitality REIT, Inc. holds a top-quartile position (#0 of 50) within the Finance, Insurance, And Real Estate sector, based on our composite quantitative scoring across quality, value, momentum, and stability factors. The composite score of 37.2/100 places it at rank #3873 in our full 7,333-stock universe. At $2.8B in market capitalization, Apple Hospitality REIT, Inc. is a mid-cap player in the Finance, Insurance, And Real Estate space, which limits certain scale advantages but may allow for more agile strategic execution.
Revenue contraction of -4% combined with momentum at the 28th percentile paints a cautious picture of the near-term business outlook. The market appears to be pricing in continued challenges, and a catalyst for reversal is not clearly visible from current data.
The margin cascade tells an important story: gross margins of 41% (-35.5pp vs sector) narrow to operating margins of 19% (+2.4pp vs sector) and net margins of 13.6%, yielding a gross-to-net conversion rate of 33%. This efficient conversion suggests well-controlled operating costs and limited margin leakage between the gross and net levels.
At a current price of $12.15, Apple Hospitality REIT, Inc. is trading near fair value based on current fundamentals. Our value factor score of 50/100 reflects a composite assessment across multiple valuation metrics including price-to-earnings, price-to-book, EV/EBITDA, and price-to-sales ratios relative to both sector peers and the broader market. Valuation metrics are mixed, with no strong signal of mispricing in either direction.
The stock currently trades at a P/E of 14.5x (a 21% premium to the sector median of 11.9x), EV/EBITDA of 9.3x (near the sector median), P/B of 0.9x, P/S of 2.0x. The above-sector P/E multiple suggests the market is pricing in superior growth or quality, which our analysis finds only partially justified by current fundamentals.
Gross margins of 41% signal strong pricing power and brand/IP advantages — businesses with margins above 40% have historically demonstrated more resilient earnings through economic cycles.
A 8.47% dividend yield provides income while you wait, and dividends historically account for a significant portion of total equity returns.
The Avoid rating (composite 37.2/100) reflects multi-factor weakness, and historically, stocks in this scoring range have underperformed the market by a meaningful margin.
Revenue decline of -4% signals business deterioration — declining revenues make it difficult to grow into the current valuation and often precede further negative revisions.
Weak momentum (28th percentile) suggests institutional selling pressure and unfavorable technical dynamics that may persist.
We assign a Medium uncertainty rating to Apple Hospitality REIT, Inc.. The stock presents a balanced risk profile: weak quality scores (30th percentile). While not risk-free, the core business fundamentals are adequate to withstand moderate economic stress, and the range of potential outcomes around our fair value estimate is manageable.
Specific risk factors that inform our assessment include: weak quality scores (30th percentile). Each of these factors independently widens the distribution of potential outcomes, and in combination they create a risk profile that demands careful position sizing. The stability factor at the 50th percentile and quality factor at the 30th percentile provide a quantitative summary of the overall risk landscape.
Key risk mitigants include: healthy gross margins of 41% provide a buffer against cost pressures; a 8.47% dividend yield anchors total return. These factors partially offset the identified risks and provide downside protection in adverse scenarios. On balance, the risk-reward profile is favorable for long-term investors.
We rate Apple Hospitality REIT, Inc.'s capital allocation as Standard. Management has shown adequate — though not exceptional — stewardship of shareholder capital. Returns on equity stand at 6.3%, and the balance sheet is managed within acceptable parameters (D/E: 47%). Exemplary allocators typically sustain ROE above 20% and D/E below 50%; Apple Hospitality REIT, Inc. falls short on at least one dimension.
There is room for improvement in optimizing the capital structure or enhancing shareholder returns. The 8.47% dividend yield provides some income return, but the overall capital allocation framework would benefit from either higher reinvestment returns, improved balance sheet efficiency, or increased shareholder distributions. We will monitor for signs of strategic improvement that could warrant an upgrade.
In summary, Apple Hospitality REIT, Inc. receives a Avoid rating with a composite score of 37.2/100 (rank #3873 of 7,333). Our quantitative framework assigns a No Moat (23/100, trend: stable), Medium uncertainty, and Standard capital allocation. The average factor score across quality, value, momentum, stability, and investment is 38/100.
Our analysis does not support a constructive view on Apple Hospitality REIT, Inc. at this time. The combination of limited competitive advantages, medium uncertainty, and standard capital allocation suggests unfavorable risk-reward at current levels. We recommend investors avoid new positions and existing holders consider reducing exposure.
Analysis derived from Blank Capital Research quantitative terminal. For informational purposes only. No trade solicitation. Past performance not indicative of future results. Consult a qualified advisor.
We do not assign Apple Hospitality REIT, Inc. a meaningful economic moat, scoring 23/100 on our composite assessment. The ROIC-WACC spread of -3.2% is the primary signal of economic value creation. Current fundamentals do not demonstrate the kind of durable competitive advantages — such as superior returns on invested capital, margin superiority, or reinvestment efficiency — that would protect the company from competitive erosion over the long term. The highest-scoring pillar, margin superiority, reached only 9.4/20.
The strongest moat sources are margin superiority (9.4/20) and growth durability (5.8/20). GM 41% vs sector 77%, OM 19% vs sector 17%. Rev growth -4%, 10yr history. These pillars form the core of Apple Hospitality REIT, Inc.'s competitive identity and are the primary drivers of excess returns in our framework.
Areas of relative weakness include reinvestment efficiency (0/20) and financial resilience (3.3/20). Capital turnover 0.26x. Improvement in these areas could meaningfully widen the moat over time, while deterioration would be an early warning of competitive erosion.
Our moat trend assessment is Stable. Multi-year ROIC and operating margin trajectories show neither meaningful improvement nor deterioration, suggesting the competitive position is steady. We expect Apple Hospitality REIT, Inc.'s moat profile to remain largely unchanged absent a material shift in return on capital or industry dynamics.
Key profit drivers include gross margins of 41% providing a solid profitability foundation, operating margins of 19% reflecting effective cost management, declining revenues (-4%) that pressure the earnings outlook. The margin cascade from 41% gross to 19% operating to 13.6% net reveals the company's cost structure and reinvestment intensity. Our analysis indicates that profit quality raises some durability concerns, with the quality factor at the 30th percentile.
The margin profile shows gross margins of 41%, operating margins of 19%, net margins of 13.6%. Return metrics include ROE of 6.3% and ROA of 4.1%. Relative to the Finance, Insurance, And Real Estate sector, gross margins are 35.5 percentage points below the sector median of 77%, and ROE of 6.3% compares to a sector median of 8.9%.
The balance sheet reflects moderate leverage with D/E of 47%, a dividend yield of 8.47%, revenue growth of -4%. The sector median D/E is 0%, putting Apple Hospitality REIT, Inc. at higher leverage than the typical peer. The combination of low leverage and healthy profitability provides significant financial resilience and strategic optionality.
Below-average quality (30th percentile) raises durability concerns about the fundamental profile and increases the risk of negative earnings surprises.

Apple Hospitality (APLE) reported better-than-expected Q4 earnings and revenue despite year-over-year declines in both figures. The lodging REIT anticipates a comparable RevPAR decline of 1.00% to 1.00% growth for 2026, indicating a cautious outlook despite the recent beat.
Apple Hospitality REIT has garnered renewed attention due to positive coverage from Barclays and Cantor Fitzgerald, increased insider share purchases including by the CEO, and the acquisition of a new Nashville property for US$98.2 million. While these developments are positive for sentiment, the core investment narrative still includes slower earnings growth, higher debt, and competition. Investors are now evaluating how portfolio expansion like the new Motto by Hilton Nashville Downtown will impact the company's financial performance against existing challenges.

Apple Hospitality REIT (NYSE:APLE) announced the resignation of board member Kristian Gathright after seven years. The company stated this was not due to disagreements, but the departure prompts a review of governance, particularly given the hotel sector's changing dynamics. Analysts suggest the stock is undervalued, but recent momentum has been slightly negative.
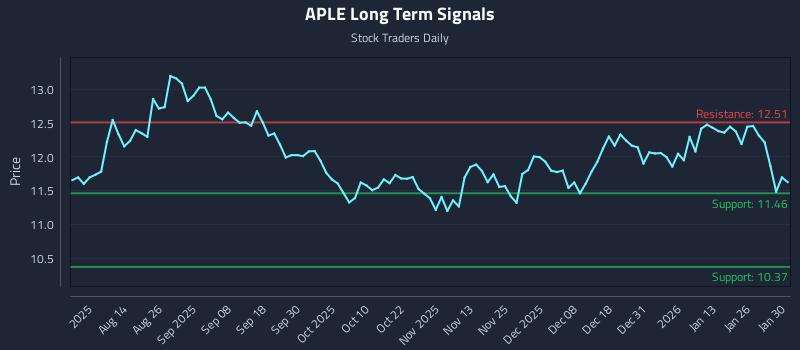
This article analyzes Apple Hospitality Reit Inc. (NASDAQ: APLE), highlighting weak near and mid-term sentiment, although the long-term outlook is neutral. It identifies an exceptional 35.0:1 risk-reward setup, targeting a 9.2% gain against a 0.3% risk. The piece presents three AI-generated trading strategies—Position Trading, Momentum Breakout, and Risk Hedging—tailored for different risk profiles and holding periods, alongside multi-timeframe signal analysis.

Motto by Hilton Nashville Downtown has opened in Nashville's SoBro neighborhood, offering 260 compact rooms with flexible connecting options ideal for groups. Managed by Chartwell Hospitality and owned by Apple Hospitality REIT, the hotel features amenities like Junie's Drink and Graze, a fitness center, and meeting spaces, all within walking distance of major attractions. This opening marks a significant addition to Motto by Hilton's portfolio in vibrant urban destinations.
Above 50MA
37.18%
Net New Highs
+51081