Equity Research Analysis: WABASH NATIONAL Corp (WNC)
|Blank Capital Research Unit|Spot: $10.60
Price$10.60
Composite Score56.8/100
RatingHOLD (3★)
Rank#1050 OF 7,333
Market Cap$401M
IMPORTANT DISCLAIMER: Blank Capital Research ("BCR") is a technology platform, not a registered investment advisor or broker-dealer. The algorithmically generated signals, scores, and rankings provided on this site ("God Mode" Signals) are for informational and research purposes only and do not constitute financial advice, investment recommendations, or an offer to sell or solicit an offer to buy any securities.
HYPOTHETICAL PERFORMANCE RESULTS: The "timing scores" and "regime signals" displayed are based on quantitative models. Hypothetical or simulated performance results have certain inherent limitations. Unlike an actual performance record, simulated results do not represent actual trading. Also, since the trades have not actually been executed, the results may have under-or-over compensated for the impact, if any, of certain market factors, such as lack of liquidity.
RISK OF LOSS: Trading in financial markets involves a high degree of risk and may result in the loss of your entire investment. Data provided by third-party sources (Intrinio, Snowflake) is believed to be reliable but is not guaranteed for accuracy or completeness. Past performance is not indicative of future results.
© 2026 Blank Capital Research. All rights reserved. System Version: Aegis V8 (God Mode).
Verdict
Quantitative factor alignment verified for current market regime.
Quant Score
Rank
#1050
Positioning
Market Dominance
Manufacturing
Automobiles And Trucks
$401M
Brent L. Yeagy
Wabash National Corporation designs, manufactures, and distributes engineered solutions for the transportation, logistics, and distribution industries. The company operates through two segments, Transportation Solutions and Parts & Services. The Transportation Solutions segment provides dry van and platform trailers; refrigerated trailers, refrigerated truck bodies; and used trailers, as well as laminated hardwood oak flooring products. The parts & Services segment provides aftermarket parts and services.
Headcount
6.9K
Get full access to institutional-quality research tools with Blank Capital Pro.
Upgrade to ProStarting at $19.99/mo
Get full access to institutional-quality research tools with Blank Capital Pro.
Upgrade to ProStarting at $19.99/mo
Dates updated upon official exchange announcement.
Get full access to institutional-quality research tools with Blank Capital Pro.
Upgrade to ProStarting at $19.99/mo
Get full access to institutional-quality research tools with Blank Capital Pro.
Upgrade to ProStarting at $19.99/mo
Get full access to institutional-quality research tools with Blank Capital Pro.
Upgrade to ProStarting at $19.99/mo
X-AXIS: EV/EBITDA (LOWER = CHEAPER) | Y-AXIS: ROE (HIGHER = ELITE) | RED CIRCLE = WNC ANALYSIS TARGET
| Stock | Rating | Score▼ | Quality | Value | Momentum | P/E | EV/EBITDA | ROE | ROA | Gross Mgn | Op Mgn | Net Mgn | Rev Growth | Div Yield | D/E | Mkt Cap | AUDIT |
|---|---|---|---|---|---|---|---|---|---|---|---|---|---|---|---|---|---|
$UL UNILEVER PLC | 78 | 96 | 98 | 59 | - | - | - | - | - | - | - | - | - | - | $0 | VS | |
$ASML ASML HOLDING NV | 77 | 89 | 86 | 83 | - | - | - | - | - | - | - | - | - | - | $0 | VS | |
$ESLT ELBIT SYSTEMS LTD | 76 | 81 | 87 | 85 | - | - | - | - | - | - | - | - | - | - | $0 | VS | |
$MT ArcelorMittal | 75 | 71 | 98 | 85 | - | - | - | - | - | - | - | - | - | - | $0 | VS | |
$AMAT APPLIED MATERIALS INC /DE | 75 | 85 | 87 | 84 | 20.9x | 13.6x | 32.9% | 20.5% | 48.8% | 30.6% | 24.4% | 7.7% | 0.9% | 32.0x | $148.6B | VS | |
$SIMO Silicon Motion Technology CORP | 75 | 84 | 86 | 85 | - | - | - | - | - | - | - | - | - | - | $0 | VS | |
$CODA Coda Octopus Group, Inc. | 74 | 83 | 90 | 79 | 16.3x | 11.9x | 7.4% | 7.5% | 68.3% | 19.5% | 18.2% | 29.0% | 0.0% | 0.0x | $84M | VS | |
$GSK GSK plc | 74 | 84 | 90 | 70 | - | - | - | - | - | - | - | - | - | - | $0 | VS | |
$EFXT Enerflex Ltd. | 74 | 80 | 91 | 83 | - | - | - | - | - | - | - | - | - | - | $0 | VS | |
$BUD Anheuser-Busch InBev SA/NV | 74 | 84 | 97 | 63 | - | - | - | - | - | - | - | - | - | - | $0 | VS | |
$WNC WABASH NATIONAL Corp | 57 | 57 | 75 | 45 | 2.1x | 0.3x | -18.5% | -5.8% | 7.5% | 0.8% | -0.5% | -30.7% | 3.3% | 218.0x | $401M | ||
| SECTOR BENCH | - | - | - | - | - | 22.3x | 11.5x | -1.9% | 0.9% | 44.1% | 2.5% | 1.0% | 6.7% | 0.0% | 0.2x | - | REF |
WABASH NATIONAL Corp (WNC) receives a "Hold" rating with a composite score of 56.8/100. It ranks #1050 out of 7,333 stocks in our coverage universe and carries a 3-star rating. Ratings are driven by a 6-factor quantitative model measuring quality, value, momentum, investment, stability, and short interest.
Sign in to join the discussion.
HQ Base
LAFAYETTE, Indiana
In-line with peers — no strong momentum signal
Trading at a discount to fundamentals — favorable entry valuation
Average quality profile
Average volatility — neutral timing signal
Aggressive spending — empire-building risk, dilutive growth
Mid-range overall rating
Get full access to institutional-quality research tools with Blank Capital Pro.
Upgrade to ProStarting at $19.99/mo
Relative valuation derived from Manufacturing sector benchmarks. Model weights: EV/EBITDA (40%), P/B (35%), P/S (25%). Re-calculated daily.
Projection based on user-defined inputs. Re-calculated daily against current market data.
Reverse DCF Framework — Mauboussin Methodology
Institutional-grade Reverse DCF analysis. This model identifies the growth hurdles embedded in current market prices. When implied growth is significantly lower than historical or projected rates, a margin of safety may exist. Re-audited daily.
No analyst ratings for WNC.
View All RatingsROIC 70.9% vs WACC 5.6% (spread +65.3%)
GM 8% vs sector 44%, OM 1% vs sector 3%
Capital turnover 4.66x, R&D intensity 0.4%
Rev growth -31%, 10yr history
Interest coverage 57.2x, Net debt/EBITDA 0.9x
Composite assessment of profitability, capital efficiency, and financial strength. Top-tier entities demonstrate sustainable cash flow generation and elite competitive moats.
Profit generated per dollar of shareholder equity
Efficiency of asset utilization
Pricing power and cost efficiency
Core business profitability
Bottom-line profitability
The Quality factor evaluates the persistence and magnitude of realized cash flows. Companies with scores >70 exhibit superior pricing power and structural financial resilience through diverse economic regimes.
Our uncertainty rating tracks the predictability of future cash flows and potential for permanent capital loss. Moderate visibility with standard industry cyclicality.
We rate WABASH NATIONAL Corp (WNC) as a Hold with a composite score of 56.8/100 at a current price of $10.60. The stock presents a mixed quantitative picture — neither compelling enough to warrant new accumulation nor weak enough to justify selling.
WABASH NATIONAL Corp holds a top-quartile position (#0 of 50) within the Manufacturing sector, based on our composite quantitative scoring across quality, value, momentum, and stability factors. The composite score of 56.8/100 places it at rank #1050 in our full universe.
Narrow
High
Poor
Undervalued
Value factor score of 75 suggests attractive pricing.
Stable competitive position in a defensive sector.
Leverage of 218% D/E amplifies downside risk.
Vulnerability to macroeconomic shocks and interest rate volatility.
WABASH NATIONAL Corp represents a hold based on multi-factor quantitative performance.
Our model assigns WABASH NATIONAL Corp a Hold rating, with a composite score of 56.8/100 and 3 out of 5 stars. Ranked #1050 of 7,333 stocks, WNC presents a mixed quantitative picture — neither compelling enough to initiate new positions nor weak enough to warrant selling. Investors already holding may consider maintaining their position while monitoring for changes in the factor profile.
With a quality score of 57/100, WNC shows adequate but unremarkable business quality. The company reports a return on equity of -18.5% (sector avg: -1.9%), gross margins of 7.5% (sector avg: 44.1%), net margins of -0.5% (sector avg: 1.0%). This suggests the company generates acceptable returns but may lack the competitive positioning or operational efficiency to stand out from peers.
WNC carries a solid value score of 75/100, pointing to an attractively priced stock relative to peers. Key valuation metrics include a P/E ratio of 2.13x, an EV/EBITDA of 0.32x, a P/B ratio of 1.27x. This score suggests reasonable compensation for the risks involved, with potential upside if the market recognizes the stock's underlying worth.
WABASH NATIONAL Corp's investment score of 33/100 suggests limited reinvestment activity. Key growth metrics include revenue growth of -30.7% vs. a sector average of 6.7% and a return on assets of -5.8% (sector: 0.9%). While this can be positive for mature, cash-generative businesses returning capital to shareholders, it may also signal a lack of growth opportunities or management conservatism.
WNC is currently showing below-average momentum at 45/100, which may indicate weakening institutional interest or negative sentiment shifts. Revenue growth stands at -30.7% year-over-year, while a beta of 1.15 reflects its sensitivity to broader market moves. Investors should note that declining momentum can precede further price weakness, though contrarian opportunities sometimes emerge at these levels.
With a stability score of 53/100, WNC exhibits average financial resilience. Key stability metrics include a beta of 1.15 and a debt-to-equity ratio of 218.00x (sector avg: 0.2x). While the balance sheet is not a major concern, the stock is subject to typical market volatility and may experience sharper drawdowns during risk-off episodes.
WNC carries a short interest score of 62/100, indicating moderate short selling activity. This is a neutral reading — not enough to signal systemic bearishness, but worth monitoring. Specific risk factors include elevated leverage (D/E: 218.00x), small-cap liquidity risk. At $401M market cap (small-cap), WABASH NATIONAL Corp offers reasonable institutional liquidity.
WNC pays a solid dividend yield of 3.3%, contributing an income component to total returns. This moderate yield suggests a balance between returning capital to shareholders and retaining earnings for reinvestment — a common profile among quality compounders.
WABASH NATIONAL Corp is a small-cap company in the Manufacturing sector, ranked #0 of 50 in its sector (100th percentile) and #1050 of 7,333 overall (86th percentile). Key comparisons include ROE of -18.5% trailing the -1.9% sector median and operating margins of 0.8% below the 2.5% sector average. This top-quartile standing reflects exceptional competitive strength relative to Manufacturing peers.
While WNC currently exhibits a HOLD profile, superior opportunities exist within the MANUFACTURING sector. Our model identifies several "Strong Buy" candidates with higher quality scores and more attractive valuations among direct industry competitors.
View Top Manufacturing Alpha →Quant Factor Profile
Key factor gap
Value (75) vs Investment (33) — closing this gap could shift the rating.
EV/EBITDA 97% BELOW SECTOR MEDIAN (FAVORABLE)
ROE 875% ABOVE SECTOR MEDIAN (FAVORABLE)
Gross Margin 83% BELOW SECTOR MEDIAN
Above 50MA
37.18%
Net New Highs
+51081

Wabash National Corporation reported a wider-than-expected loss for Q3 2025, with an EPS of -$0.51, significantly missing the forecast and revenue also falling short of expectations. The company is navigating a prolonged freight recession, leading to a stock drop of 7.82% in pre-market trading and revised full-year guidance. Despite immediate challenges, Wabash focuses on innovation, cost discipline, and its resilient Parts and Services business, anticipating a gradual market recovery in 2026.

Wabash National Corporation (NYSE:WNC) shareholders have experienced a 44% loss over the past year, significantly underperforming the market's 20% gain. The company's revenue also declined by 25% in the last year, and it was not profitable, suggesting a challenging period for the stock. Despite a long-term five-year return of 0.2% annually for longer-term investors, the current situation highlights a lack of both profits and revenue growth, prompting questions about future growth or cost-cutting strategies.

Wabash (NYSE:WNC) reported better-than-expected revenue of $321.5 million in Q4 CY2025, surpassing analyst estimates, but sales still declined by 22.9% year-on-year. Despite the revenue beat, the company's non-GAAP loss per share was worse than expected, and its Q1 CY2026 revenue guidance of $320 million fell significantly below analyst projections, causing the stock to drop 7.5% immediately after the announcement. The report also highlighted ongoing struggles with long-term revenue growth, declining backlog, and a challenging freight market impacting capital spending decisions by customers.
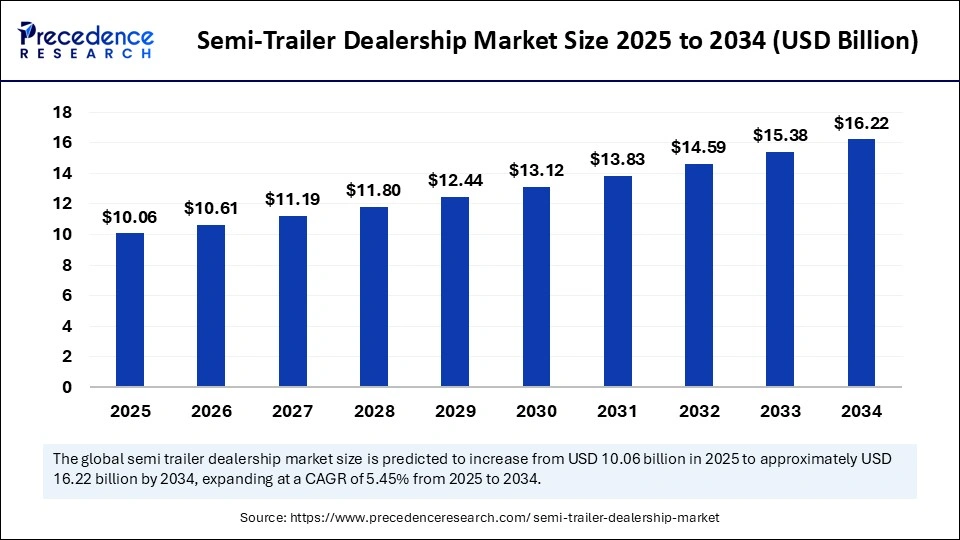
The global semi-trailer dealership market is projected to grow from USD 9.54 billion in 2024 to USD 16.22 billion by 2034, at a CAGR of 5.45%. This growth is primarily driven by the increasing demand for efficient freight transportation, fueled by the expansion of logistics and e-commerce industries. Key market segments include dry van trailers and authorized OEM dealerships, with North America dominating the market and Asia Pacific expected to be the fastest-growing region.
Wabash National Corp. and ArvinMeritor Inc. have secured a three-year, $120 million agreement with U.S. Xpress Enterprises for over 7,000 Wabash DuraPlate branded trailers. These trailers will feature ArvinMeritor's advanced air suspension and axle systems, alongside GeoLogic, an asset monitoring and tracking system by Aether Systems Inc. This significant order marks the second major deal of its kind for Wabash National in less than three months.