Equity Research Analysis: TEVA PHARMACEUTICAL INDUSTRIES LTD (TEVA)
|Blank Capital Research Unit|Spot: $34.22
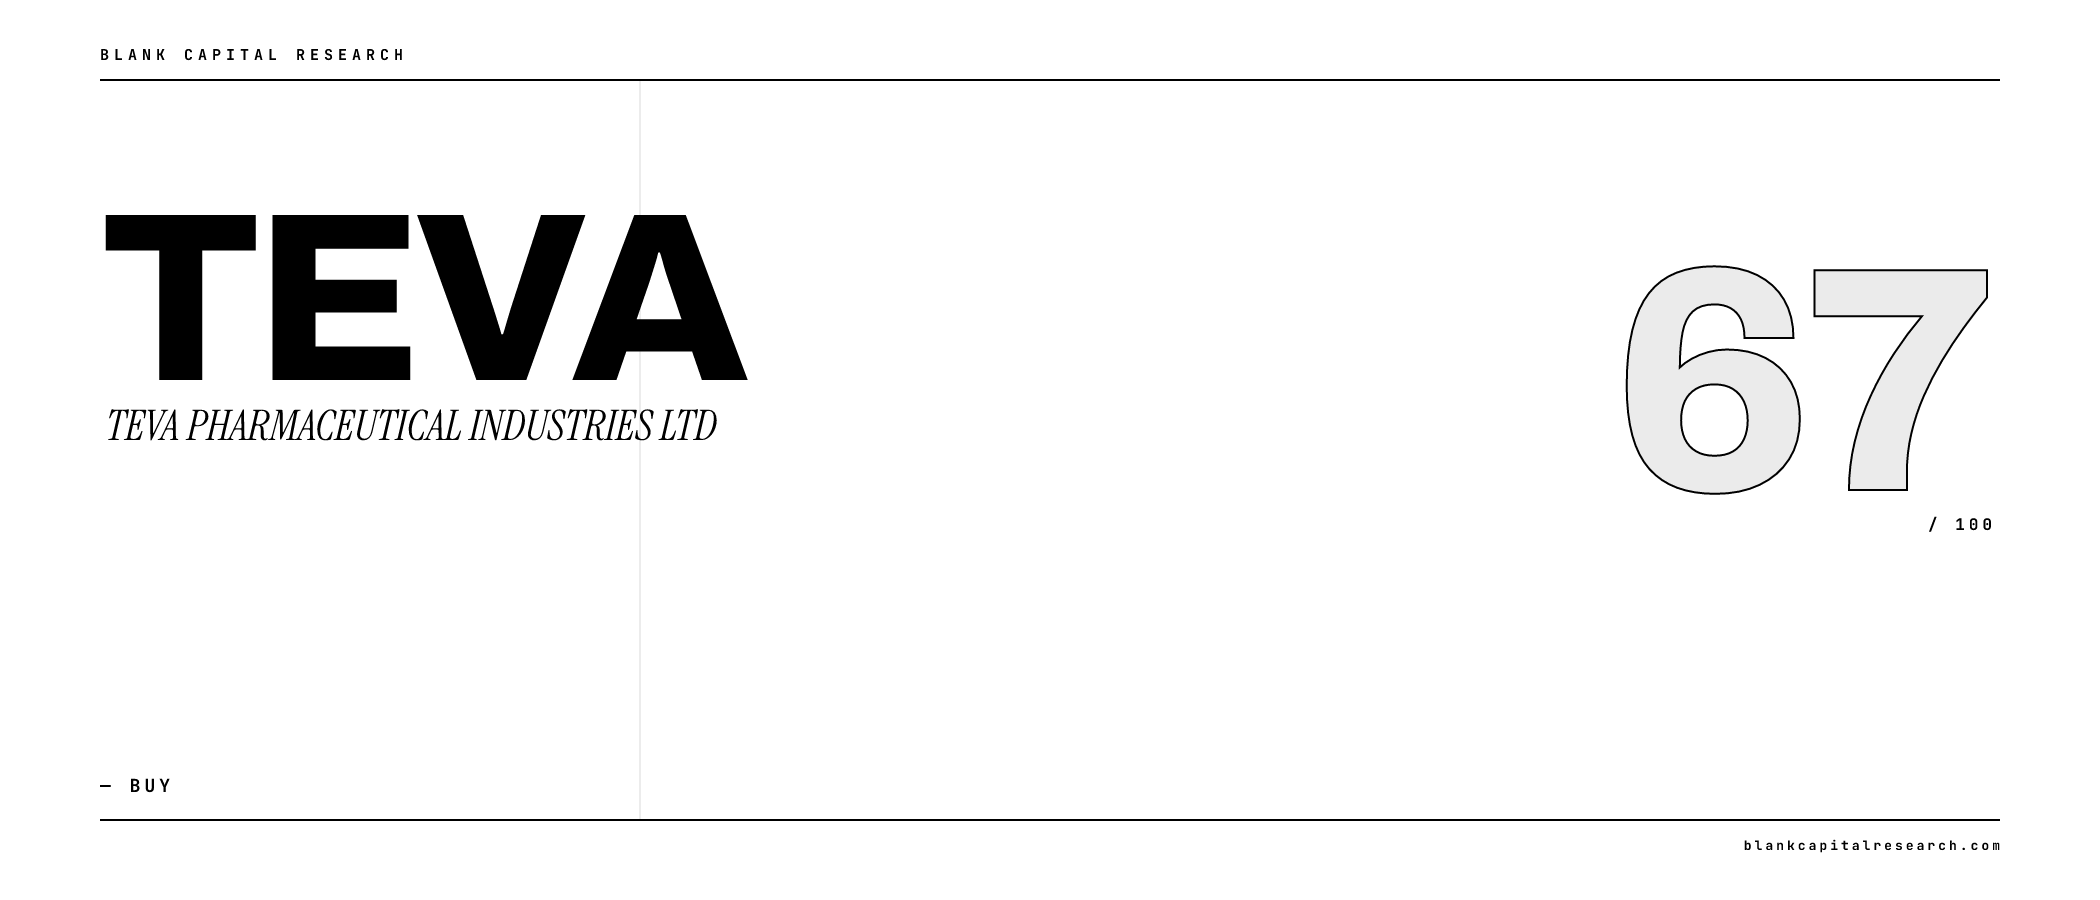
Price$34.22
Composite Score67.0/100
RatingBUY (4★)
Rank#194 OF 7,333
Market Cap$23.2B
IMPORTANT DISCLAIMER: Blank Capital Research ("BCR") is a technology platform, not a registered investment advisor or broker-dealer. The algorithmically generated signals, scores, and rankings provided on this site ("God Mode" Signals) are for informational and research purposes only and do not constitute financial advice, investment recommendations, or an offer to sell or solicit an offer to buy any securities.
HYPOTHETICAL PERFORMANCE RESULTS: The "timing scores" and "regime signals" displayed are based on quantitative models. Hypothetical or simulated performance results have certain inherent limitations. Unlike an actual performance record, simulated results do not represent actual trading. Also, since the trades have not actually been executed, the results may have under-or-over compensated for the impact, if any, of certain market factors, such as lack of liquidity.
RISK OF LOSS: Trading in financial markets involves a high degree of risk and may result in the loss of your entire investment. Data provided by third-party sources (Intrinio, Snowflake) is believed to be reliable but is not guaranteed for accuracy or completeness. Past performance is not indicative of future results.
© 2026 Blank Capital Research. All rights reserved. System Version: Aegis V8 (God Mode).
Verdict
Quantitative factor alignment verified for current market regime.
Quant Score
Rank
#194
Positioning
Market Dominance
Manufacturing
Pharmaceutical Products
$23.2B
Kåre Schultz
Teva Pharmaceutical Industries Limited sells generic medicines, specialty medicines, and biopharmaceutical products in North America, Europe, and internationally. Its products in the central nervous system, pain, respiratory, and oncology areas include Copaxone for the treatment of relapsing forms of multiple sclerosis. The company was founded in 1901 and is headquartered in Tel Aviv-Yafo, Israel.
Headcount
36.8K
Get full access to institutional-quality research tools with Blank Capital Pro.
Upgrade to ProStarting at $19.99/mo
Get full access to institutional-quality research tools with Blank Capital Pro.
Upgrade to ProStarting at $19.99/mo
Get full access to institutional-quality research tools with Blank Capital Pro.
Upgrade to ProStarting at $19.99/mo
Get full access to institutional-quality research tools with Blank Capital Pro.
Upgrade to ProStarting at $19.99/mo
Get full access to institutional-quality research tools with Blank Capital Pro.
Upgrade to ProStarting at $19.99/mo
X-AXIS: EV/EBITDA (LOWER = CHEAPER) | Y-AXIS: ROE (HIGHER = ELITE) | RED CIRCLE = TEVA ANALYSIS TARGET
| Stock | Rating | Score▼ | Quality | Value | Momentum | P/E | EV/EBITDA | ROE | ROA | Gross Mgn | Op Mgn | Net Mgn | Rev Growth | Div Yield | D/E | Mkt Cap | AUDIT |
|---|---|---|---|---|---|---|---|---|---|---|---|---|---|---|---|---|---|
$UL UNILEVER PLC | 78 | 96 | 98 | 59 | - | - | - | - | - | - | - | - | - | - | $0 | VS | |
$ASML ASML HOLDING NV | 77 | 89 | 86 | 83 | - | - | - | - | - | - | - | - | - | - | $0 | VS | |
$ESLT ELBIT SYSTEMS LTD | 76 | 81 | 87 | 85 | - | - | - | - | - | - | - | - | - | - | $0 | VS | |
$MT ArcelorMittal | 75 | 71 | 98 | 85 | - | - | - | - | - | - | - | - | - | - | $0 | VS | |
$AMAT APPLIED MATERIALS INC /DE | 75 | 85 | 87 | 84 | 20.9x | 13.6x | 32.9% | 20.5% | 48.8% | 30.6% | 24.4% | 7.7% | 0.9% | 32.0x | $148.6B | VS | |
$SIMO Silicon Motion Technology CORP | 75 | 84 | 86 | 85 | - | - | - | - | - | - | - | - | - | - | $0 | VS | |
$CODA Coda Octopus Group, Inc. | 74 | 83 | 90 | 79 | 16.3x | 11.9x | 7.4% | 7.5% | 68.3% | 19.5% | 18.2% | 29.0% | 0.0% | 0.0x | $84M | VS | |
$GSK GSK plc | 74 | 84 | 90 | 70 | - | - | - | - | - | - | - | - | - | - | $0 | VS | |
$EFXT Enerflex Ltd. | 74 | 80 | 91 | 83 | - | - | - | - | - | - | - | - | - | - | $0 | VS | |
$BUD Anheuser-Busch InBev SA/NV | 74 | 84 | 97 | 63 | - | - | - | - | - | - | - | - | - | - | $0 | VS | |
$TEVA TEVA PHARMACEUTICAL INDUSTRIES LTD | 67 | 65 | 82 | 83 | 72.9x | 14.2x | 6.9% | 1.3% | 49.9% | 10.7% | 3.3% | 7.6% | 0.0% | 415.0x | $23.2B | ||
| SECTOR BENCH | - | - | - | - | - | 22.3x | 11.5x | -1.9% | 0.9% | 44.1% | 2.5% | 1.0% | 6.7% | 0.0% | 0.2x | - | REF |
TEVA PHARMACEUTICAL INDUSTRIES LTD (TEVA) receives a "Buy" rating with a composite score of 67.0/100. It ranks #194 out of 7,333 stocks in our coverage universe and carries a 4-star rating. Ratings are driven by a 6-factor quantitative model measuring quality, value, momentum, investment, stability, and short interest.
Sign in to join the discussion.
HQ Base
Petah Tikva,
Outperforming peers — winners tend to keep winning over 3-12 months
Trading at a discount to fundamentals — favorable entry valuation
High profitability & efficiency — strong quality floor supports entry
Low volatility — smoother ride and historically better risk-adjusted returns
Aggressive spending — empire-building risk, dilutive growth
Top-rated overall — multiple factors aligned for strong entry
Get full access to institutional-quality research tools with Blank Capital Pro.
Upgrade to ProStarting at $19.99/mo
Relative valuation derived from Manufacturing sector benchmarks. Model weights: EV/EBITDA (40%), P/B (35%), P/S (25%). Re-calculated daily.
Projection based on user-defined inputs. Re-calculated daily against current market data.
Reverse DCF Framework — Mauboussin Methodology
Institutional-grade Reverse DCF analysis. This model identifies the growth hurdles embedded in current market prices. When implied growth is significantly lower than historical or projected rates, a margin of safety may exist. Re-audited daily.
No analyst ratings for TEVA.
View All RatingsROIC 14.8% vs WACC 8.5% (spread +6.3%)
GM 50% vs sector 44%, OM 11% vs sector 3%
Capital turnover 1.18x
Rev growth 8%, 10yr history
Interest coverage 2.4x, Net debt/EBITDA 4.6x
Composite assessment of profitability, capital efficiency, and financial strength. Top-tier entities demonstrate sustainable cash flow generation and elite competitive moats.
Profit generated per dollar of shareholder equity
Efficiency of asset utilization
Pricing power and cost efficiency
Core business profitability
Bottom-line profitability
The Quality factor evaluates the persistence and magnitude of realized cash flows. Companies with scores >70 exhibit superior pricing power and structural financial resilience through diverse economic regimes.
Our uncertainty rating tracks the predictability of future cash flows and potential for permanent capital loss. Moderate visibility with standard industry cyclicality.
We rate TEVA PHARMACEUTICAL INDUSTRIES LTD (TEVA) as a Buy with a composite score of 67.0/100 at a current price of $34.22. The stock scores above average across the majority of our quantitative factors and ranks #194, reflecting a favorable risk-reward profile.
TEVA PHARMACEUTICAL INDUSTRIES LTD holds a top-quartile position (#0 of 50) within the Manufacturing sector, based on our composite quantitative scoring across quality, value, momentum, and stability factors. The composite score of 67.0/100 places it at rank #194 in our full universe.
The near-term outlook is constructive, with revenue growing at 8% and momentum in the 83th percentile confirming positive market sentiment. The combination of strong top-line growth and favorable price dynamics suggests the company is executing well on its growth strategy.
Narrow
High
Poor
Undervalued
Gross margins of 50% signal strong pricing power.
Value factor score of 82 suggests attractive pricing.
Positive momentum indicates institutional accumulation.
Elevated P/E ratio of 72.9x leaves little room for execution misses.
Leverage of 415% D/E amplifies downside risk.
Vulnerability to macroeconomic shocks and interest rate volatility.
TEVA PHARMACEUTICAL INDUSTRIES LTD represents a buy based on multi-factor quantitative performance.
TEVA PHARMACEUTICAL INDUSTRIES LTD receives a Buy rating with a composite score of 67.0/100 and 4 out of 5 stars, ranking #194 of 7,333 stocks in our universe. TEVA displays a favorable combination of factors that positions it above the majority of the market. While not without risk, the quantitative profile supports a constructive outlook.
TEVA earns a quality score of 65/100, indicating above-average business quality. The company reports a return on equity of 6.9% (sector avg: -1.9%), gross margins of 49.9% (sector avg: 44.1%), net margins of 3.3% (sector avg: 1.0%). Companies in this tier generally demonstrate consistent profitability and efficient capital deployment, though they may face some competitive pressure.
TEVA carries a solid value score of 82/100, pointing to an attractively priced stock relative to peers. Key valuation metrics include a P/E ratio of 72.86x, an EV/EBITDA of 14.19x, a P/B ratio of 5.04x. This score suggests reasonable compensation for the risks involved, with potential upside if the market recognizes the stock's underlying worth.
TEVA PHARMACEUTICAL INDUSTRIES LTD's investment score of 30/100 suggests limited reinvestment activity. Key growth metrics include revenue growth of 7.6% vs. a sector average of 6.7% and a return on assets of 1.3% (sector: 0.9%). While this can be positive for mature, cash-generative businesses returning capital to shareholders, it may also signal a lack of growth opportunities or management conservatism.
TEVA shows strong momentum characteristics with a score of 83/100. The stock has been trending above key moving averages, indicating solid demand from institutional buyers. Revenue growth stands at 7.6% year-over-year, while a beta of 0.91 reflects its sensitivity to broader market moves. This level of momentum typically signals sustained investor confidence and favorable near-term price action.
TEVA shows good financial stability with a score of 77/100. Key stability metrics include a beta of 0.91 and a debt-to-equity ratio of 415.00x (sector avg: 0.2x). This suggests manageable leverage and moderate price volatility, making it appropriate for investors seeking a balance between growth potential and capital preservation.
TEVA PHARMACEUTICAL INDUSTRIES LTD's short interest score of 37/100 reveals significant bearish positioning, suggesting institutional investors are actively betting against the stock. Specific risk factors include elevated leverage (D/E: 415.00x). At $23.2B (large-cap), TEVA carries meaningful risk and is best suited for investors with high risk tolerance who have thoroughly evaluated the bear thesis.
TEVA PHARMACEUTICAL INDUSTRIES LTD is a large-cap company in the Manufacturing sector, ranked #0 of 50 in its sector (100th percentile) and #194 of 7,333 overall (97th percentile). Key comparisons include ROE of 6.9% exceeding the -1.9% sector median and operating margins of 10.7% above the 2.5% sector average. This top-quartile standing reflects exceptional competitive strength relative to Manufacturing peers.
Quant Factor Profile
Key factor gap
Momentum (83) vs Investment (30) — closing this gap could shift the rating.
EV/EBITDA 24% ABOVE SECTOR MEDIAN
ROE 464% BELOW SECTOR MEDIAN
Gross Margin 13% ABOVE SECTOR MEDIAN (FAVORABLE)
Above 50MA
37.18%
Net New Highs
+51081
About TEVA PHARMACEUTICAL INDUSTRIES LTD Teva Pharmaceutical Industries Limited, a pharmaceutical company, develops, manufactures, markets, and distributes generic medicines, specialty medicines, and biopharmaceutical products in North America, Europe, and internationally. The company offers sterile products, hormones, high-potency drugs, and cytotoxic substances in various dosage forms, including tablets, capsules, injectables, inhalants, liquids, transdermal patches, ointments, and creams. It
The Hormone Replacement Therapy (HRT) market is poised to expand significantly from $23.58 billion in 2025 to $38.18 billion by 2033, driven by a CAGR of 6.21%. Key growth drivers include technological advancements, innovations in delivery methods, and rising cases of hormonal disorders. Increased awareness and acceptance of HRT, largely for menopause-related symptoms in women, alongside supportive government policies, further contribute to market growth. The sector sees immense potential, parti
PARSIPPANY, N.J. and TEL AVIV, Israel, Feb. 24, 2026 (GLOBE NEWSWIRE) -- Teva Pharmaceutical Industries Ltd. (NYSE and TASE: TEVA) today announced that Richard Francis, Teva's President and CEO, will participate in the upcoming investor conferences in March as follows: UBS European Healthcare Conference Tuesday, March 3, 2026 (investor meetings only – no webcast)Leerink Partners Global Healthcare ConferenceMonday, March 9, 2026, at 10:00 am ET (webcast fireside chat)Barclays 28th Annual Global H

Harel Insurance Investments & Financial Services Ltd. sold 4.177 million shares of the Invesco KBW Bank ETF (KBWB) worth approximately $330 million, reducing its position to virtually zero. The sale reflects concerns about lower interest rates pressuring bank profitability, with the proceeds being reallocated to healthcare and technology holdings.
This specialty retailer delivers personal care and home fragrance products through a broad network of stores and online channels.