Equity Research Analysis: Funko, Inc. (FNKO)
|Blank Capital Research Unit|Spot: $5.09
Price$5.09
Composite Score57.2/100
RatingHOLD (3★)
Rank#1003 OF 7,333
Market Cap$190M
P/E Ratio
IMPORTANT DISCLAIMER: Blank Capital Research ("BCR") is a technology platform, not a registered investment advisor or broker-dealer. The algorithmically generated signals, scores, and rankings provided on this site ("God Mode" Signals) are for informational and research purposes only and do not constitute financial advice, investment recommendations, or an offer to sell or solicit an offer to buy any securities.
HYPOTHETICAL PERFORMANCE RESULTS: The "timing scores" and "regime signals" displayed are based on quantitative models. Hypothetical or simulated performance results have certain inherent limitations. Unlike an actual performance record, simulated results do not represent actual trading. Also, since the trades have not actually been executed, the results may have under-or-over compensated for the impact, if any, of certain market factors, such as lack of liquidity.
RISK OF LOSS: Trading in financial markets involves a high degree of risk and may result in the loss of your entire investment. Data provided by third-party sources (Intrinio, Snowflake) is believed to be reliable but is not guaranteed for accuracy or completeness. Past performance is not indicative of future results.
© 2026 Blank Capital Research. All rights reserved. System Version: Aegis V8 (God Mode).
Verdict
Quantitative factor alignment verified for current market regime.
Quant Score
Rank
#1003
Positioning
Market Dominance
Manufacturing
Recreation
$190M
Andrew M. Perlmutter
Funko, Inc., a pop culture consumer products company, designs, sources, and distributes licensed pop culture products. The company provides vinyl, blind-packed miniature, and action figures; fashion accessories, including bags, backpacks, and wallets. It also licenses its properties under the classic evergreen, movie release, current TV, and current video game categories.
Headcount
1.1K
Get full access to institutional-quality research tools with Blank Capital Pro.
Upgrade to ProStarting at $19.99/mo
Get full access to institutional-quality research tools with Blank Capital Pro.
Upgrade to ProStarting at $19.99/mo
Get full access to institutional-quality research tools with Blank Capital Pro.
Upgrade to ProStarting at $19.99/mo
Get full access to institutional-quality research tools with Blank Capital Pro.
Upgrade to ProStarting at $19.99/mo
Get full access to institutional-quality research tools with Blank Capital Pro.
Upgrade to ProStarting at $19.99/mo
X-AXIS: EV/EBITDA (LOWER = CHEAPER) | Y-AXIS: ROE (HIGHER = ELITE) | RED CIRCLE = FNKO ANALYSIS TARGET
| Stock | Rating | Score▼ | Quality | Value | Momentum | P/E | EV/EBITDA | ROE | ROA | Gross Mgn | Op Mgn | Net Mgn | Rev Growth | Div Yield | D/E | Mkt Cap | AUDIT |
|---|---|---|---|---|---|---|---|---|---|---|---|---|---|---|---|---|---|
$UL UNILEVER PLC | 78 | 96 | 98 | 59 | - | - | 28.5% | 8.0% | 100.0% | 100.0% | 10.4% | -4.6% | 3.3% | 0.0x | $141.8B | VS | |
$ASML ASML HOLDING NV | 77 | 89 | 86 | 83 | - | - | 46.1% | 16.6% | 51.3% | 31.9% | 26.8% | -4.0% | 1.0% | 25.0x | $272.1B | VS | |
$ESLT ELBIT SYSTEMS LTD | 76 | 81 | 87 | 85 | - | - | 10.3% | 3.1% | 24.1% | 7.2% | 4.7% | 14.3% | 0.8% | 25.0x | $11.4B | VS | |
$MT ArcelorMittal | 75 | 71 | 98 | 85 | - | - | 2.2% | 1.5% | 9.3% | 5.3% | 2.2% | -8.5% | 2.2% | 16.0x | $18.9B | VS | |
$AMAT APPLIED MATERIALS INC /DE | 75 | 85 | 87 | 84 | 20.9x | 13.6x | 35.5% | 19.8% | 48.7% | 29.2% | 24.7% | 4.4% | 0.8% | 32.0x | $181.9B | VS | |
$SIMO Silicon Motion Technology CORP | 75 | 84 | 86 | 85 | - | - | 11.8% | 8.8% | 45.9% | 11.3% | 11.1% | 25.7% | 3.7% | 0.0x | $1.8B | VS | |
$CODA Coda Octopus Group, Inc. | 74 | 83 | 90 | 79 | 16.3x | 11.9x | 7.6% | 7.0% | 66.5% | 17.1% | 15.6% | 39.0% | 0.0% | 0.0x | $115M | VS | |
$GSK GSK plc | 74 | 84 | 90 | 70 | - | - | 22.6% | 4.9% | 71.2% | 12.8% | 9.4% | 1.7% | 5.9% | 124.0x | $72.1B | VS | |
$EFXT Enerflex Ltd. | 74 | 80 | 91 | 83 | - | - | 3.0% | 1.1% | 20.9% | 7.3% | 1.3% | 3.0% | 0.9% | 67.0x | $1.2B | VS | |
$BUD Anheuser-Busch InBev SA/NV | 74 | 84 | 97 | 63 | - | - | 8.2% | 3.5% | 55.3% | 25.9% | 12.4% | 0.7% | 1.7% | 0.0x | $87.0B | VS | |
$FNKO Funko, Inc. | 57 | 65 | 82 | 46 | 242.5x | 19.7x | -34.6% | -9.1% | 40.9% | -5.9% | -8.5% | 1.3% | 0.0% | 58.0x | $190M | ||
| SECTOR BENCH | - | - | - | - | - | 22.3x | 11.5x | -2.5% | -0.1% | 42.5% | 1.3% | -0.2% | 5.9% | 0.0% | 0.2x | - | REF |
Funko, Inc. (FNKO) receives a "Hold" rating with a composite score of 57.2/100. It ranks #1003 out of 7,333 stocks in our coverage universe and carries a 3-star rating. Ratings are driven by a 6-factor quantitative model measuring quality, value, momentum, investment, stability, and short interest.
Sign in to join the discussion.
YOY expansion rate
Core pricing power
Operating efficiency
Bottom-line conversion
Equity capital efficiency
Asset base utilization
Financial leverage load
Direct cash return
Andrew M. Perlmutter
Chief Executive Officer
Labor Force
1,090
65
34
20
Audit Verdict: Lower quality and stability scores may indicate governance concerns.
No recent insider transactions available for FNKO
HQ Base
Pending Verification
In-line with peers — no strong momentum signal
Trading at a discount to fundamentals — favorable entry valuation
High profitability & efficiency — strong quality floor supports entry
High volatility — wider range of outcomes increases timing risk
Aggressive spending — empire-building risk, dilutive growth
Mid-range overall rating
Get full access to institutional-quality research tools with Blank Capital Pro.
Upgrade to ProStarting at $19.99/mo
Relative valuation derived from Manufacturing sector benchmarks. Model weights: EV/EBITDA (40%), P/B (35%), P/S (25%). Re-calculated daily.
Projection based on user-defined inputs. Re-calculated daily against current market data.
Reverse DCF Framework — Mauboussin Methodology
Institutional-grade Reverse DCF analysis. This model identifies the growth hurdles embedded in current market prices. When implied growth is significantly lower than historical or projected rates, a margin of safety may exist. Re-audited daily.
No analyst ratings for FNKO.
View All RatingsConservative accounting — High cash conversion efficiency
Material decline in asset turnover efficiency detected
High margin volatility — erratic forensic earnings quality
ROIC 7.8% vs WACC 8.2% (spread -0.4%)
GM 41% vs sector 43%, OM -6% vs sector 1%
Capital turnover 3.76x
Rev growth 1%, 9yr history
Interest coverage N/A, Net debt/EBITDA 3.2x
Composite assessment of profitability, capital efficiency, and financial strength. Top-tier entities demonstrate sustainable cash flow generation and elite competitive moats.
Profit generated per dollar of shareholder equity
Efficiency of asset utilization
Pricing power and cost efficiency
Core business profitability
Bottom-line profitability
The Quality factor evaluates the persistence and magnitude of realized cash flows. Companies with scores >70 exhibit superior pricing power and structural financial resilience through diverse economic regimes.
Our uncertainty rating tracks the predictability of future cash flows and potential for permanent capital loss. Moderate visibility with standard industry cyclicality.
Our model assigns Funko, Inc. a Hold rating, with a composite score of 57.2/100 and 3 out of 5 stars. Ranked #1003 of 7,333 stocks, FNKO presents a mixed quantitative picture — neither compelling enough to initiate new positions nor weak enough to warrant selling. Investors already holding may consider maintaining their position while monitoring for changes in the factor profile.
FNKO earns a quality score of 65/100, indicating above-average business quality. The company reports a return on equity of -34.6% (sector avg: -2.5%), gross margins of 40.9% (sector avg: 42.5%), net margins of -8.5% (sector avg: -0.2%). Companies in this tier generally demonstrate consistent profitability and efficient capital deployment, though they may face some competitive pressure.
FNKO carries a solid value score of 82/100, pointing to an attractively priced stock relative to peers. Key valuation metrics include a P/E ratio of 242.50x, an EV/EBITDA of 19.69x, a P/B ratio of 1.56x. This score suggests reasonable compensation for the risks involved, with potential upside if the market recognizes the stock's underlying worth.
Funko, Inc.'s investment score of 34/100 suggests limited reinvestment activity. Key growth metrics include revenue growth of 1.3% vs. a sector average of 5.9% and a return on assets of -9.1% (sector: -0.1%). While this can be positive for mature, cash-generative businesses returning capital to shareholders, it may also signal a lack of growth opportunities or management conservatism.
FNKO is currently showing below-average momentum at 46/100, which may indicate weakening institutional interest or negative sentiment shifts. Revenue growth stands at 1.3% year-over-year, while a beta of 2.55 reflects its sensitivity to broader market moves. Investors should note that declining momentum can precede further price weakness, though contrarian opportunities sometimes emerge at these levels.
Funko, Inc. registers a low stability score of 20/100, indicating high volatility and potentially stressed financial conditions. Key stability metrics include a beta of 2.55 and a debt-to-equity ratio of 58.00x (sector avg: 0.2x). Stocks at this level carry elevated capital loss risk and may be unsuitable for conservative portfolios without careful risk management.
The short interest score of 58/100 for FNKO suggests somewhat elevated bearish positioning by institutional traders. Specific risk factors include high market sensitivity (beta: 2.55), elevated leverage (D/E: 58.00x), micro-cap liquidity risk. With a $190M market cap (micro-cap), Funko, Inc. may experience above-average volatility. Investors should consider whether the short thesis has merit or if it creates a potential short-squeeze opportunity.
Funko, Inc. is a micro-cap company in the Manufacturing sector, ranked #0 of 50 in its sector (100th percentile) and #1003 of 7,333 overall (86th percentile). Key comparisons include ROE of -34.6% trailing the -2.5% sector median and operating margins of -5.9% below the 1.3% sector average. This top-quartile standing reflects exceptional competitive strength relative to Manufacturing peers.
While FNKO currently exhibits a HOLD profile, superior opportunities exist within the MANUFACTURING sector. Our model identifies several "Strong Buy" candidates with higher quality scores and more attractive valuations among direct industry competitors.
View Top Manufacturing Alpha →Quant Factor Profile
Key factor gap
Value (82) vs Stability (20) — closing this gap could shift the rating.
EV/EBITDA 72% ABOVE SECTOR MEDIAN
ROE 1295% ABOVE SECTOR MEDIAN (FAVORABLE)
Gross Margin IN LINE WITH SECTOR BENCHMARKS
AUDIT DATA AS OF SEP 30, 2025 (Q2 FY2025)
We rate Funko, Inc. (FNKO) as a Hold with a composite score of 57.2/100 at a current price of $5.09. The stock presents a mixed quantitative picture — neither compelling enough to warrant new accumulation nor weak enough to justify selling for existing holders. Our factors are split, and the overall profile suggests patience is warranted.
The rating is primarily driven by strength in value (82th percentile) and quality (65th percentile), which together account for the majority of the composite score. Offsetting weakness in stability (20th percentile) and investment (34th percentile) tempers our overall conviction. We assign a No Moat rating (36/100), Very High uncertainty, and Poor capital allocation.
Key items to watch: the path to profitability. Any material change in these dynamics could warrant a reassessment of our rating. The moat trend is stable, which suggests the competitive landscape is stable for now.
Funko, Inc. holds a top-quartile position (#0 of 50) within the Manufacturing sector, based on our composite quantitative scoring across quality, value, momentum, and stability factors. The composite score of 57.2/100 places it at rank #1003 in our full 7,333-stock universe. At $190M in market capitalization, Funko, Inc. is a small-cap player in the Manufacturing space, which limits certain scale advantages but may allow for more agile strategic execution.
Revenue is growing at 1%, though momentum at the 46th percentile suggests the market has not yet fully recognized this trajectory. This potential disconnect between fundamental improvement and market recognition could represent an opportunity for patient investors if the growth trend persists.
The margin cascade tells an important story: gross margins of 41% (-1.6pp vs sector) narrow to operating margins of -6% (-7.2pp vs sector) and net margins of -8.5%, yielding a gross-to-net conversion rate of -21%. The significant margin erosion from gross to net suggests elevated operating expenses, high interest costs, or other structural drags that warrant monitoring.
At a current price of $5.09, Funko, Inc. appears undervalued relative to its fundamentals. Our value factor score of 82/100 reflects a composite assessment across multiple valuation metrics including price-to-earnings, price-to-book, EV/EBITDA, and price-to-sales ratios relative to both sector peers and the broader market. The stock screens as attractively priced on a majority of these measures, suggesting the market may be underappreciating the underlying fundamentals.
The stock currently trades at a P/E of 242.5x (a 990% premium to the sector median of 22.3x), EV/EBITDA of 19.7x (at a premium), P/B of 1.6x, P/S of 0.3x. The above-sector P/E multiple suggests the market is pricing in superior growth or quality, which our analysis partially supports given strong quality metrics.
Gross margins of 41% signal strong pricing power and brand/IP advantages — businesses with margins above 40% have historically demonstrated more resilient earnings through economic cycles.
A value factor score of 82/100 suggests the market is underpricing these fundamentals, creating a potential margin of safety for new investors.
A P/E of 242.5x leaves little room for execution misses — any earnings disappointment could trigger a sharp multiple compression.
Thin net margins of -8.5% provide limited cushion against cost pressures, competitive pricing, or macroeconomic headwinds — even small changes in costs could swing the company to a loss.
High beta of 2.55 means amplified losses in market selloffs — in a broad market correction, this stock would likely decline more than the index.
We assign a Very High uncertainty rating to Funko, Inc.. The stock exhibits multiple compounding risk factors: elevated market sensitivity (beta of 2.55), current negative profitability (net margin -8.5%), below-average price stability (20th percentile). The extreme uncertainty around future cash flows makes precise valuation difficult, and the range of outcomes is exceptionally wide. Only investors with high risk tolerance and extended time horizons should consider this name.
Specific risk factors that inform our assessment include: elevated market sensitivity (beta of 2.55); current negative profitability (net margin -8.5%); below-average price stability (20th percentile); elevated valuation multiple (P/E 242.5x) that leaves limited margin for error. Each of these factors independently widens the distribution of potential outcomes, and in combination they create a risk profile that demands careful position sizing. The stability factor at the 20th percentile and quality factor at the 65th percentile provide a quantitative summary of the overall risk landscape.
Key risk mitigants include: healthy gross margins of 41% provide a buffer against cost pressures. These factors partially offset the identified risks and provide downside protection in adverse scenarios. On balance, the risk-reward profile warrants caution and disciplined position management.
We rate Funko, Inc.'s capital allocation as Poor. Key concerns include low returns on equity (-34.6%), negative profitability, weak asset returns (ROA -9.1%). Exemplary capital allocators generate ROE above 20% and maintain conservative leverage — Funko, Inc. significantly underperforms these benchmarks, raising questions about management's ability to create shareholder value.
Investors should scrutinize management's reinvestment decisions and balance sheet trajectory before committing capital. Poor capital allocation often compounds over time: overlevered balance sheets limit strategic flexibility, while low returns on capital destroy shareholder value. We would need to see sustained improvement in profitability metrics and balance sheet discipline before considering an upgrade.
In summary, Funko, Inc. receives a Hold rating with a composite score of 57.2/100 (rank #1003 of 7,333). Our quantitative framework assigns a No Moat (36/100, trend: stable), Very High uncertainty, and Poor capital allocation. The average factor score across quality, value, momentum, stability, and investment is 49/100.
Our analysis supports a neutral stance on Funko, Inc.. While the quantitative profile is not weak enough to warrant selling, it lacks the multi-factor strength required for a buy recommendation. Existing holders should maintain positions and monitor for catalysts — either fundamental improvement or valuation compression — that would shift the risk-reward balance.
Analysis derived from Blank Capital Research quantitative terminal. For informational purposes only. No trade solicitation. Past performance not indicative of future results. Consult a qualified advisor.
We do not assign Funko, Inc. a meaningful economic moat, scoring 36/100 on our composite assessment. The ROIC-WACC spread of -0.4% is the primary signal of economic value creation. Current fundamentals do not demonstrate the kind of durable competitive advantages — such as superior returns on invested capital, margin superiority, or reinvestment efficiency — that would protect the company from competitive erosion over the long term. The highest-scoring pillar, margin superiority, reached only 10.8/20.
The strongest moat sources are margin superiority (10.8/20) and reinvestment efficiency (10/20). GM 41% vs sector 43%, OM -6% vs sector 1%. Capital turnover 3.76x. These pillars form the core of Funko, Inc.'s competitive identity and are the primary drivers of excess returns in our framework.
Areas of relative weakness include economic value creation (3.9/20) and growth durability (5.2/20). ROIC 7.8% vs WACC 8.2% (spread -0.4%). Improvement in these areas could meaningfully widen the moat over time, while deterioration would be an early warning of competitive erosion.
Our moat trend assessment is Stable. Multi-year ROIC and operating margin trajectories show neither meaningful improvement nor deterioration, suggesting the competitive position is steady. We expect Funko, Inc.'s moat profile to remain largely unchanged absent a material shift in return on capital or industry dynamics.
Key profit drivers include gross margins of 41% providing a solid profitability foundation. The margin cascade from 41% gross to -6% operating to -8.5% net reveals the company's cost structure and reinvestment intensity. Our analysis indicates that the profit engine is high-quality and likely sustainable, with the quality factor at the 65th percentile.
The margin profile shows gross margins of 41%, operating margins of -6%, net margins of -8.5%. Return metrics include ROE of -34.6% and ROA of -9.1%. Relative to the Manufacturing sector, gross margins are 1.6 percentage points below the sector median of 43%, and ROE of -34.6% compares to a sector median of -2.5%.
The balance sheet reflects moderate leverage with D/E of 58%, revenue growth of 1%. The sector median D/E is 0%, putting Funko, Inc. at higher leverage than the typical peer. Overall balance sheet health is adequate for the current business environment.
Above 50MA
37.18%
Net New Highs
+51081
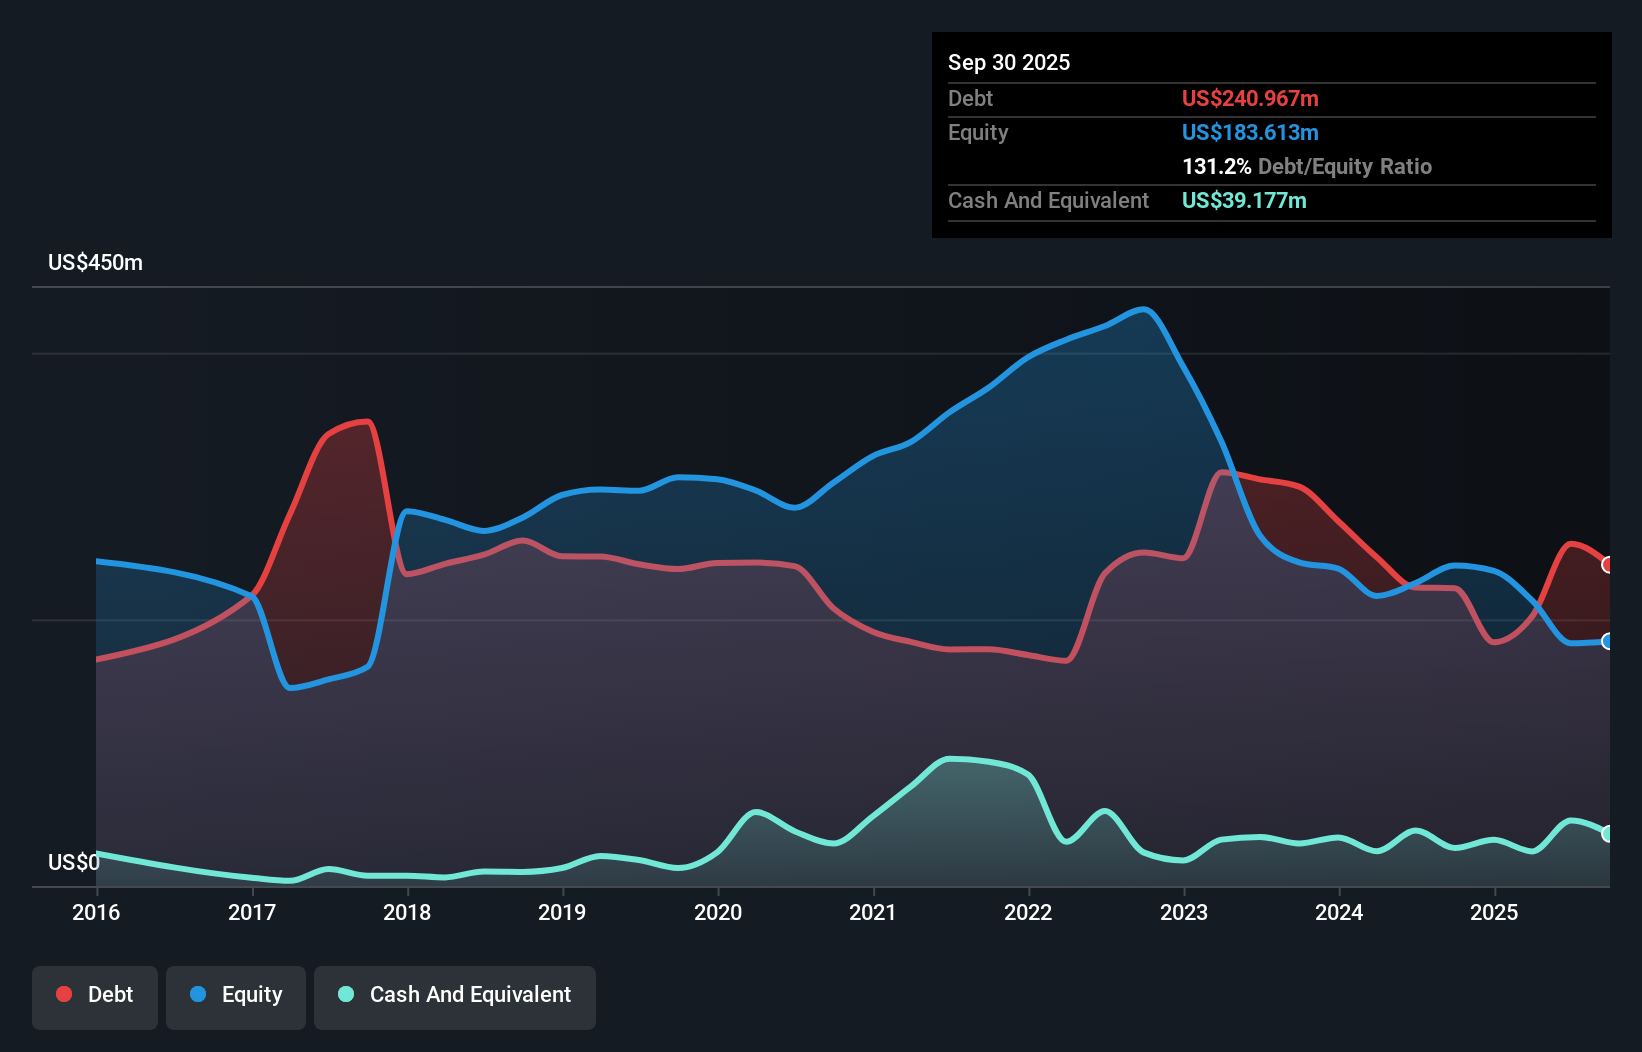
Funko (NASDAQ:FNKO) is carrying significant debt, with net debt of US$201.8m as of September 2025, and reported a loss of US$45m at the EBIT level alongside an 11% revenue drop to US$929m. The company's liabilities of US$348.0m outweigh its cash and near-term receivables, raising concerns given its current market capitalization of US$175.0m. Analysts suggest that the company would require major recapitalization if creditors demanded payment immediately, emphasizing the need for quick operational improvement.

Funko (NASDAQ: FNKO) saw its stock jump 9.8% after reporting strong Q3 2025 financial results. Despite a 14.3% drop in net sales to $250.9 million, missing forecasts, the company's adjusted earnings per share of $0.06 significantly surpassed expectations for a loss, and adjusted EBITDA of $24.43 million outperformed by over 60%. Investors reacted positively to the better-than-expected cost management and profitability, causing the shares to close up 10.3% at $3.33.

Funko Inc (NASDAQ:FNKO) reported mixed Q3 2025 financial results, with earnings significantly surpassing analyst forecasts despite a revenue miss. The company's stock surged approximately 14.2% in after-market trading, indicating investor focus on the profitability beat and successful cost management. Under new CEO Josh Simon, Funko demonstrated strong gross margins and provided positive guidance for Q4 2025, signaling a potential return to sales growth.
Funko, Inc. has granted its new CEO, Josh Simon, an inducement restricted stock unit award covering 1,000,000 shares of the Company's Class A common stock. This award vests over four years in equal annual installments, contingent on Mr. Simon's continued employment. The grant was made to induce Mr. Simon to join Funko, in accordance with Nasdaq Listing Rule 5635(c)(4).
A consortium led by The Chernin Group (TCG) will acquire a $263 million strategic investment in Funko, a pop culture lifestyle brand, taking an 80% stake from ACON Investments. This all-secondary transaction values Funko shares at $21.00 each, with TCG and its consortium owning 25% of the company post-acquisition. The investment includes commercial agreements with eBay Inc. and strategic advising for Funko's growth in content, commerce, and new product categories.