Equity Research Analysis: ASTRONICS CORP (ATRO)
|Blank Capital Research Unit|Spot: $78.55
Price$78.55
Composite Score67.4/100
RatingBUY (4★)
Rank#182 OF 7,333
Market Cap$1.6B
ROE
IMPORTANT DISCLAIMER: Blank Capital Research ("BCR") is a technology platform, not a registered investment advisor or broker-dealer. The algorithmically generated signals, scores, and rankings provided on this site ("God Mode" Signals) are for informational and research purposes only and do not constitute financial advice, investment recommendations, or an offer to sell or solicit an offer to buy any securities.
HYPOTHETICAL PERFORMANCE RESULTS: The "timing scores" and "regime signals" displayed are based on quantitative models. Hypothetical or simulated performance results have certain inherent limitations. Unlike an actual performance record, simulated results do not represent actual trading. Also, since the trades have not actually been executed, the results may have under-or-over compensated for the impact, if any, of certain market factors, such as lack of liquidity.
RISK OF LOSS: Trading in financial markets involves a high degree of risk and may result in the loss of your entire investment. Data provided by third-party sources (Intrinio, Snowflake) is believed to be reliable but is not guaranteed for accuracy or completeness. Past performance is not indicative of future results.
© 2026 Blank Capital Research. All rights reserved. System Version: Aegis V8 (God Mode).
Verdict
Quantitative factor alignment verified for current market regime.
Quant Score
Rank
#182
Positioning
Market Dominance
Manufacturing
Aircraft
$1.6B
Peter J. Gundermann
Astronics Corporation designs and manufactures products for aerospace, defense, and electronics industries. The Aerospace segment offers lighting and safety systems, electrical power generation systems, distribution and seat motions systems, aircraft structures, avionics products, system certification, and other products. The Test Systems segment designs, develops, manufactures, and maintains automated test systems that support the aerospace and defense industries. It serves OEMs and prime government contractors for electronics and military products.
Headcount
2.1K
Get full access to institutional-quality research tools with Blank Capital Pro.
Upgrade to ProStarting at $19.99/mo
Get full access to institutional-quality research tools with Blank Capital Pro.
Upgrade to ProStarting at $19.99/mo
Get full access to institutional-quality research tools with Blank Capital Pro.
Upgrade to ProStarting at $19.99/mo
Get full access to institutional-quality research tools with Blank Capital Pro.
Upgrade to ProStarting at $19.99/mo
Get full access to institutional-quality research tools with Blank Capital Pro.
Upgrade to ProStarting at $19.99/mo
X-AXIS: EV/EBITDA (LOWER = CHEAPER) | Y-AXIS: ROE (HIGHER = ELITE) | RED CIRCLE = ATRO ANALYSIS TARGET
| Stock | Rating | Score▼ | Quality | Value | Momentum | P/E | EV/EBITDA | ROE | ROA | Gross Mgn | Op Mgn | Net Mgn | Rev Growth | Div Yield | D/E | Mkt Cap | AUDIT |
|---|---|---|---|---|---|---|---|---|---|---|---|---|---|---|---|---|---|
$UL UNILEVER PLC | 78 | 96 | 98 | 59 | - | - | 28.5% | 8.0% | 100.0% | 100.0% | 10.4% | -4.6% | 3.3% | 0.0x | $141.8B | VS | |
$ASML ASML HOLDING NV | 77 | 89 | 86 | 83 | - | - | 46.1% | 16.6% | 51.3% | 31.9% | 26.8% | -4.0% | 1.0% | 25.0x | $272.1B | VS | |
$ESLT ELBIT SYSTEMS LTD | 76 | 81 | 87 | 85 | - | - | 10.3% | 3.1% | 24.1% | 7.2% | 4.7% | 14.3% | 0.8% | 25.0x | $11.4B | VS | |
$MT ArcelorMittal | 75 | 71 | 98 | 85 | - | - | 2.2% | 1.5% | 9.3% | 5.3% | 2.2% | -8.5% | 2.2% | 16.0x | $18.9B | VS | |
$AMAT APPLIED MATERIALS INC /DE | 75 | 85 | 87 | 84 | 20.9x | 13.6x | 35.5% | 19.8% | 48.7% | 29.2% | 24.7% | 4.4% | 0.8% | 32.0x | $181.9B | VS | |
$SIMO Silicon Motion Technology CORP | 75 | 84 | 86 | 85 | - | - | 11.8% | 8.8% | 45.9% | 11.3% | 11.1% | 25.7% | 3.7% | 0.0x | $1.8B | VS | |
$CODA Coda Octopus Group, Inc. | 74 | 83 | 90 | 79 | 16.3x | 11.9x | 7.6% | 7.0% | 66.5% | 17.1% | 15.6% | 39.0% | 0.0% | 0.0x | $115M | VS | |
$GSK GSK plc | 74 | 84 | 90 | 70 | - | - | 22.6% | 4.9% | 71.2% | 12.8% | 9.4% | 1.7% | 5.9% | 124.0x | $72.1B | VS | |
$EFXT Enerflex Ltd. | 74 | 80 | 91 | 83 | - | - | 3.0% | 1.1% | 20.9% | 7.3% | 1.3% | 3.0% | 0.9% | 67.0x | $1.2B | VS | |
$BUD Anheuser-Busch InBev SA/NV | 74 | 84 | 97 | 63 | - | - | 8.2% | 3.5% | 55.3% | 25.9% | 12.4% | 0.7% | 1.7% | 0.0x | $87.0B | VS | |
$ATRO ASTRONICS CORP | 67 | 71 | 65 | 92 | - | 56.5x | -11.0% | -1.8% | 26.7% | 5.9% | -1.4% | 6.7% | 0.0% | 526.0x | $1.6B | ||
| SECTOR BENCH | - | - | - | - | - | 22.3x | 11.5x | -2.5% | -0.1% | 42.5% | 1.3% | -0.2% | 5.9% | 0.0% | 0.2x | - | REF |
ASTRONICS CORP (ATRO) receives a "Buy" rating with a composite score of 67.4/100. It ranks #182 out of 7,333 stocks in our coverage universe and carries a 4-star rating. Ratings are driven by a 6-factor quantitative model measuring quality, value, momentum, investment, stability, and short interest.
Sign in to join the discussion.
YOY expansion rate
Core pricing power
Operating efficiency
Bottom-line conversion
Equity capital efficiency
Asset base utilization
Financial leverage load
Direct cash return
Peter J. Gundermann
Chief Executive Officer
Labor Force
2,100
71
44
64
Audit Verdict: Average governance indicators based on financial metrics.
No recent insider transactions available for ATRO
HQ Base
EAST AURORA, New York
Outperforming peers — winners tend to keep winning over 3-12 months
Trading at a discount to fundamentals — favorable entry valuation
High profitability & efficiency — strong quality floor supports entry
Low volatility — smoother ride and historically better risk-adjusted returns
Moderate investment profile
Top-rated overall — multiple factors aligned for strong entry
Get full access to institutional-quality research tools with Blank Capital Pro.
Upgrade to ProStarting at $19.99/mo
Relative valuation derived from Manufacturing sector benchmarks. Model weights: EV/EBITDA (40%), P/B (35%), P/S (25%). Re-calculated daily.
No analyst ratings for ATRO.
View All RatingsMaterial decline in asset turnover efficiency detected
High margin volatility — erratic forensic earnings quality
| Factor | Global | Sector | Tilt |
|---|---|---|---|
| PROFITABILITY | 71 | 79 | -8DRAG |
| MOMENTUM | 92 | 95 | -3NEUTRAL |
| VALUATION | 65 | 55 | +10ALPHA |
| INVESTMENT | 44 | 81 | -37DRAG |
| STABILITY | 64 | 54 | +10ALPHA |
| SHORT INT | 40 | 33 | +7ALPHA |
Global = full universe. Sector = relative to industry peers. Positive tilt indicates idiosyncratic strength.
ROIC 5.7% vs WACC 9.5% (spread -3.9%)
GM 27% vs sector 43%, OM 6% vs sector 1%
Capital turnover 0.66x, R&D intensity 5.3%
Rev growth 7%, 10yr history
Interest coverage 0.7x, Net debt/EBITDA 13.9x
Composite assessment of profitability, capital efficiency, and financial strength. Top-tier entities demonstrate sustainable cash flow generation and elite competitive moats.
Profit generated per dollar of shareholder equity
Efficiency of asset utilization
Pricing power and cost efficiency
Core business profitability
Bottom-line profitability
The Quality factor evaluates the persistence and magnitude of realized cash flows. Companies with scores >70 exhibit superior pricing power and structural financial resilience through diverse economic regimes.
Our uncertainty rating tracks the predictability of future cash flows and potential for permanent capital loss. Moderate visibility with standard industry cyclicality.
ASTRONICS CORP receives a Buy rating with a composite score of 67.4/100 and 4 out of 5 stars, ranking #182 of 7,333 stocks in our universe. ATRO displays a favorable combination of factors that positions it above the majority of the market. While not without risk, the quantitative profile supports a constructive outlook.
ATRO earns a quality score of 71/100, indicating above-average business quality. The company reports a return on equity of -11.0% (sector avg: -2.5%), gross margins of 26.7% (sector avg: 42.5%), net margins of -1.4% (sector avg: -0.2%). Companies in this tier generally demonstrate consistent profitability and efficient capital deployment, though they may face some competitive pressure.
ATRO's value score of 65/100 indicates the stock is fairly valued based on its current fundamentals. Key valuation metrics include an EV/EBITDA of 56.52x, a P/B ratio of 25.60x. At this level, neither a clear bargain nor overpriced, the stock's attractiveness depends more on forward growth expectations and qualitative factors.
With an investment score of 44/100, ATRO exhibits moderate growth-oriented spending. Key growth metrics include revenue growth of 6.7% vs. a sector average of 5.9% and a return on assets of -1.8% (sector: -0.1%). The company appears to be balancing growth investments with capital returns, though the pace of investment may not be enough to accelerate top-line growth meaningfully.
ASTRONICS CORP (ATRO) is exhibiting exceptional momentum with a score of 92/100, placing it among the strongest trending stocks in the market. Revenue growth stands at 6.7% year-over-year, while a beta of 1.09 reflects its sensitivity to broader market moves. Stocks with momentum scores this high have historically outperformed over the following 3–12 months, suggesting ATRO may continue to benefit from strong institutional interest and positive price trends.
With a stability score of 64/100, ATRO exhibits average financial resilience. Key stability metrics include a beta of 1.09 and a debt-to-equity ratio of 526.00x (sector avg: 0.2x). While the balance sheet is not a major concern, the stock is subject to typical market volatility and may experience sharper drawdowns during risk-off episodes.
The short interest score of 40/100 for ATRO suggests somewhat elevated bearish positioning by institutional traders. Specific risk factors include elevated leverage (D/E: 526.00x), small-cap liquidity risk. With a $1.6B market cap (small-cap), ASTRONICS CORP may experience above-average volatility. Investors should consider whether the short thesis has merit or if it creates a potential short-squeeze opportunity.
ASTRONICS CORP is a small-cap company in the Manufacturing sector, ranked #0 of 50 in its sector (100th percentile) and #182 of 7,333 overall (98th percentile). Key comparisons include ROE of -11.0% trailing the -2.5% sector median and operating margins of 5.9% above the 1.3% sector average. This top-quartile standing reflects exceptional competitive strength relative to Manufacturing peers.
Quant Factor Profile
Key factor gap
Momentum (92) vs Short Int. (40) — closing this gap could shift the rating.
EV/EBITDA 393% ABOVE SECTOR MEDIAN
ROE 344% ABOVE SECTOR MEDIAN (FAVORABLE)
Gross Margin 37% BELOW SECTOR MEDIAN
AUDIT DATA AS OF SEP 27, 2025 (Q2 FY2025)
We rate ASTRONICS CORP (ATRO) as a Buy with a composite score of 67.4/100 at a current price of $78.55. The stock scores above average across the majority of our six quantitative factors and ranks #182 out of 7,333 stocks in our universe, reflecting a favorable risk-reward profile.
The rating is primarily driven by strength in momentum (92th percentile) and quality (71th percentile), which together account for the majority of the composite score. All factors score above the 40th percentile, indicating no material weakness in the quantitative profile. We assign a No Moat rating (25/100), High uncertainty, and Poor capital allocation.
Key items to watch: balance sheet deleveraging progress; the path to profitability. Any material change in these dynamics could warrant a reassessment of our rating. The moat trend is stable, which suggests the competitive landscape is stable for now.
ASTRONICS CORP holds a top-quartile position (#0 of 50) within the Manufacturing sector, based on our composite quantitative scoring across quality, value, momentum, and stability factors. The composite score of 67.4/100 places it at rank #182 in our full 7,333-stock universe. At $1.6B in market capitalization, ASTRONICS CORP is a small-cap player in the Manufacturing space, which limits certain scale advantages but may allow for more agile strategic execution.
The outlook is moderately positive, with revenue expanding at 7% and favorable momentum (92th percentile) reflecting constructive market sentiment. The business shows steady execution, though the growth rate is below the levels typically associated with high-conviction growth stories. Momentum confirmation provides support for the current price level.
The margin cascade tells an important story: gross margins of 27% (-15.8pp vs sector) narrow to operating margins of 6% (+4.6pp vs sector) and net margins of -1.4%, yielding a gross-to-net conversion rate of -5%. The significant margin erosion from gross to net suggests elevated operating expenses, high interest costs, or other structural drags that warrant monitoring.
At a current price of $78.55, ASTRONICS CORP is trading near fair value based on current fundamentals. Our value factor score of 65/100 reflects a composite assessment across multiple valuation metrics including price-to-earnings, price-to-book, EV/EBITDA, and price-to-sales ratios relative to both sector peers and the broader market. Valuation metrics are mixed, with no strong signal of mispricing in either direction.
The stock currently trades at EV/EBITDA of 56.5x (at a premium), P/B of 25.6x, P/S of 3.4x. We evaluate these multiples in the context of both absolute levels and sector-relative positioning to form our valuation view.
The stock's Buy rating (composite score 67.4/100) reflects broad-based quantitative strength, placing it in the top 20% of our 7,333-stock universe.
A value factor score of 65/100 suggests the market is underpricing these fundamentals, creating a potential margin of safety for new investors.
Positive momentum (92th percentile) indicates institutional accumulation and favorable technical dynamics that tend to persist in the intermediate term.
Elevated leverage (526% D/E) amplifies downside risk and limits management's financial flexibility in adverse scenarios.
Thin net margins of -1.4% provide limited cushion against cost pressures, competitive pricing, or macroeconomic headwinds — even small changes in costs could swing the company to a loss.
We assign a High uncertainty rating to ASTRONICS CORP. Key risk factors include significant leverage (526% debt-to-equity), current negative profitability (net margin -1.4%), the combination of leverage (526% D/E) and thin margins (-1.4% net) amplifies downside risk. The wide range of potential outcomes widens our fair value estimate and increases the possibility of permanent capital impairment. Investors considering this name should size positions accordingly and demand a meaningful margin of safety before initiating.
Specific risk factors that inform our assessment include: significant leverage (526% debt-to-equity); current negative profitability (net margin -1.4%); the combination of leverage (526% D/E) and thin margins (-1.4% net) amplifies downside risk. Each of these factors independently widens the distribution of potential outcomes, and in combination they create a risk profile that demands careful position sizing. The stability factor at the 64th percentile and quality factor at the 71th percentile provide a quantitative summary of the overall risk landscape.
Key risk mitigants include: above-average stability (64th percentile) suggests predictable business dynamics. These factors partially offset the identified risks and provide downside protection in adverse scenarios. On balance, the risk-reward profile warrants caution and disciplined position management.
We rate ASTRONICS CORP's capital allocation as Poor. Key concerns include low returns on equity (-11.0%), elevated leverage (526% D/E), negative profitability, weak asset returns (ROA -1.8%). Exemplary capital allocators generate ROE above 20% and maintain conservative leverage — ASTRONICS CORP significantly underperforms these benchmarks, raising questions about management's ability to create shareholder value.
Investors should scrutinize management's reinvestment decisions and balance sheet trajectory before committing capital. Poor capital allocation often compounds over time: overlevered balance sheets limit strategic flexibility, while low returns on capital destroy shareholder value. We would need to see sustained improvement in profitability metrics and balance sheet discipline before considering an upgrade.
In summary, ASTRONICS CORP receives a Buy rating with a composite score of 67.4/100 (rank #182 of 7,333). Our quantitative framework assigns a No Moat (25/100, trend: stable), High uncertainty, and Poor capital allocation. The average factor score across quality, value, momentum, stability, and investment is 67/100.
Our analysis supports a constructive view on ASTRONICS CORP. The combination of the current valuation, high uncertainty, and poor capital allocation creates a risk-reward profile that favors accumulation at current levels. We recommend investors consider adding this name to portfolios aligned with the stock's risk profile.
Analysis derived from Blank Capital Research quantitative terminal. For informational purposes only. No trade solicitation. Past performance not indicative of future results. Consult a qualified advisor.
We do not assign ASTRONICS CORP a meaningful economic moat, scoring 25/100 on our composite assessment. The ROIC-WACC spread of -3.9% is the primary signal of economic value creation. Current fundamentals do not demonstrate the kind of durable competitive advantages — such as superior returns on invested capital, margin superiority, or reinvestment efficiency — that would protect the company from competitive erosion over the long term. The highest-scoring pillar, margin superiority, reached only 10.2/20.
The strongest moat sources are margin superiority (10.2/20) and growth durability (5.1/20). GM 27% vs sector 43%, OM 6% vs sector 1%. Rev growth 7%, 10yr history. These pillars form the core of ASTRONICS CORP's competitive identity and are the primary drivers of excess returns in our framework.
Areas of relative weakness include reinvestment efficiency (2.2/20) and economic value creation (3.7/20). Capital turnover 0.66x, R&D intensity 5.3%. Improvement in these areas could meaningfully widen the moat over time, while deterioration would be an early warning of competitive erosion.
Our moat trend assessment is Stable. Multi-year ROIC and operating margin trajectories show neither meaningful improvement nor deterioration, suggesting the competitive position is steady. We expect ASTRONICS CORP's moat profile to remain largely unchanged absent a material shift in return on capital or industry dynamics.
Key profit drivers include moderate revenue growth of 7%. The margin cascade from 27% gross to 6% operating to -1.4% net reveals the company's cost structure and reinvestment intensity. Our analysis indicates that the profit engine is high-quality and likely sustainable, with the quality factor at the 71th percentile.
The margin profile shows gross margins of 27%, operating margins of 6%, net margins of -1.4%. Return metrics include ROE of -11.0% and ROA of -1.8%. Relative to the Manufacturing sector, gross margins are 15.8 percentage points below the sector median of 43%, and ROE of -11.0% compares to a sector median of -2.5%.
The balance sheet reflects high leverage with D/E of 526%, which may limit financial flexibility, revenue growth of 7%. The sector median D/E is 0%, putting ASTRONICS CORP at higher leverage than the typical peer. Elevated leverage in combination with the current margin profile warrants close monitoring for any deterioration in debt-servicing capacity.

Several stocks, including Astronics, Great Lakes Dredge & Dock, Enphase, Viavi Solutions, and Mayville Engineering, saw significant gains after a broad market rebound. This rally was attributed to a recovery in tech stocks, a stabilization in Bitcoin, improved U.S. consumer sentiment, and massive AI-related capital expenditures benefiting chipmakers. The Dow Jones Industrial Average also surged, crossing the 50,000 threshold for the first time.
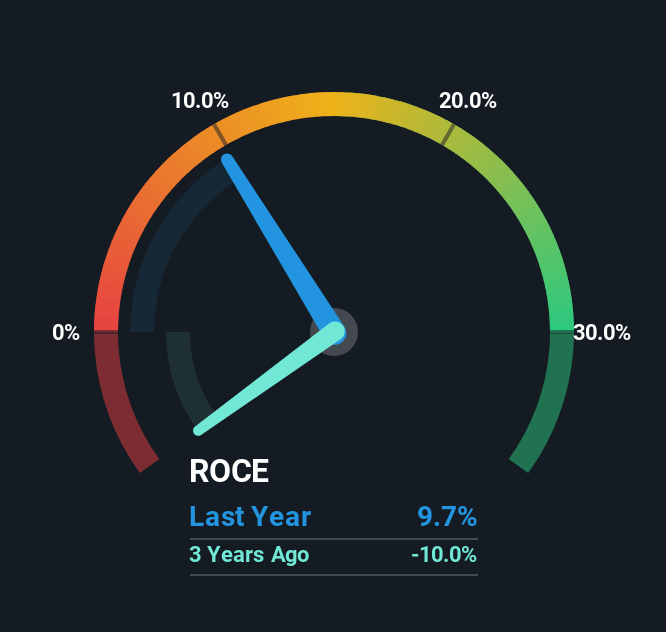
Astronics (NASDAQ:ATRO) has demonstrated promising trends in its Return on Capital Employed (ROCE) over the past five years, showing a significant increase of 1,165% while utilizing roughly the same amount of capital. This indicates improved business efficiencies and a compounding machine capable of reinvesting earnings for higher returns. The company's ROCE stands at 9.7%, which is close to the Aerospace & Defense industry average, and investors have seen a remarkable 384% total return on the stock in the last five years, suggesting expectations for continued growth.
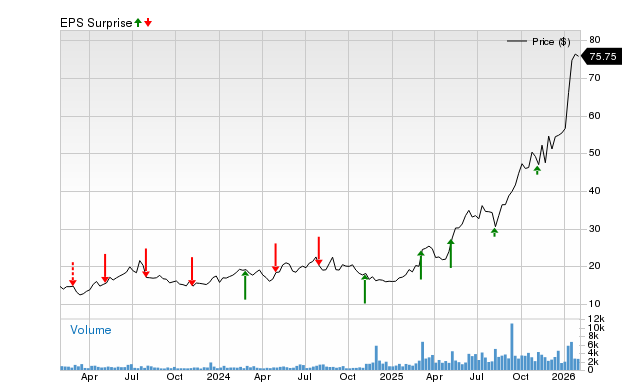
Astronics Corporation (ATRO) is positioned for another earnings beat in its upcoming quarterly report, building on a strong history of surpassing estimates. The company has a positive Zacks Earnings ESP of +4.75% and a Zacks Rank #1 (Strong Buy), indicating a high probability of exceeding consensus estimates. This analysis suggests that recent analyst revisions are bullish on Astronics' earnings prospects.
Pier 88 Investment Partners LLC initiated a new position in Astronics Corporation (NASDAQ:ATRO) during the third quarter, acquiring 14,430 shares valued at approximately $658,000. This move contributes to the overall institutional ownership of 56.68% for Astronics, with other funds also increasing their stakes. The company recently surpassed Q3 EPS estimates and holds a "Moderate Buy" consensus analyst rating.
Nordea Investment Management AB has acquired a new stake in Astronics Corporation (NASDAQ:ATRO), purchasing 92,185 shares valued at approximately $4.14 million. This move contributes to institutional investors collectively owning about 56.68% of the company. Astronics, which recently beat its earnings estimates, is trading near its 52-week high, and analysts have a "Moderate Buy" consensus rating with an average target price of $66.67.
Above 50MA
37.18%
Net New Highs
+51081