Equity Research Analysis: AMTECH SYSTEMS INC (ASYS)
|Blank Capital Research Unit|Spot: $12.27
Price$12.27
Composite Score52.2/100
RatingHOLD (3★)
Rank#1657 OF 7,333
Market Cap$133M
IMPORTANT DISCLAIMER: Blank Capital Research ("BCR") is a technology platform, not a registered investment advisor or broker-dealer. The algorithmically generated signals, scores, and rankings provided on this site ("God Mode" Signals) are for informational and research purposes only and do not constitute financial advice, investment recommendations, or an offer to sell or solicit an offer to buy any securities.
HYPOTHETICAL PERFORMANCE RESULTS: The "timing scores" and "regime signals" displayed are based on quantitative models. Hypothetical or simulated performance results have certain inherent limitations. Unlike an actual performance record, simulated results do not represent actual trading. Also, since the trades have not actually been executed, the results may have under-or-over compensated for the impact, if any, of certain market factors, such as lack of liquidity.
RISK OF LOSS: Trading in financial markets involves a high degree of risk and may result in the loss of your entire investment. Data provided by third-party sources (Intrinio, Snowflake) is believed to be reliable but is not guaranteed for accuracy or completeness. Past performance is not indicative of future results.
© 2026 Blank Capital Research. All rights reserved. System Version: Aegis V8 (God Mode).
Verdict
Quantitative factor alignment verified for current market regime.
Quant Score
Rank
#1657
Positioning
Market Dominance
Manufacturing
Machinery
$133M
Michael Whang
Amtech Systems, Inc. manufactures and sells capital equipment and related consumables for use in fabricating silicon carbide (SiC), silicon power devices, analog and discrete devices, electronic assemblies, and light-emitting diodes (LEDs) The Semiconductor segment designs, manufactures, sells, and services thermal processing equipment, including solder reflow ovens, diffusion furnaces, and customer high-temp belt furnaces. The Material and Substrate segment sells consumables and machinery for lapping and polishing of materials such as silicon wafers for semiconductor products.
Headcount
330
HQ Base
TEMPE, Arizona
Get full access to institutional-quality research tools with Blank Capital Pro.
Upgrade to ProStarting at $19.99/mo
Get full access to institutional-quality research tools with Blank Capital Pro.
Upgrade to ProStarting at $19.99/mo
Get full access to institutional-quality research tools with Blank Capital Pro.
Upgrade to ProStarting at $19.99/mo
Get full access to institutional-quality research tools with Blank Capital Pro.
Upgrade to ProStarting at $19.99/mo
Get full access to institutional-quality research tools with Blank Capital Pro.
Upgrade to ProStarting at $19.99/mo
X-AXIS: EV/EBITDA (LOWER = CHEAPER) | Y-AXIS: ROE (HIGHER = ELITE) | RED CIRCLE = ASYS ANALYSIS TARGET
| Stock | Rating | Score▼ | Quality | Value | Momentum | P/E | EV/EBITDA | ROE | ROA | Gross Mgn | Op Mgn | Net Mgn | Rev Growth | Div Yield | D/E | Mkt Cap | AUDIT |
|---|---|---|---|---|---|---|---|---|---|---|---|---|---|---|---|---|---|
$UL UNILEVER PLC | 78 | 96 | 98 | 59 | - | - | 28.5% | 8.0% | 100.0% | 100.0% | 10.4% | -4.6% | 3.3% | 0.0x | $141.8B | VS | |
$ASML ASML HOLDING NV | 77 | 89 | 86 | 83 | - | - | 46.1% | 16.6% | 51.3% | 31.9% | 26.8% | -4.0% | 1.0% | 25.0x | $272.1B | VS | |
$ESLT ELBIT SYSTEMS LTD | 76 | 81 | 87 | 85 | - | - | 10.3% | 3.1% | 24.1% | 7.2% | 4.7% | 14.3% | 0.8% | 25.0x | $11.4B | VS | |
$MT ArcelorMittal | 75 | 71 | 98 | 85 | - | - | 2.2% | 1.5% | 9.3% | 5.3% | 2.2% | -8.5% | 2.2% | 16.0x | $18.9B | VS | |
$AMAT APPLIED MATERIALS INC /DE | 75 | 85 | 87 | 84 | 20.9x | 13.6x | 35.5% | 19.8% | 48.7% | 29.2% | 24.7% | 4.4% | 0.8% | 32.0x | $181.9B | VS | |
$SIMO Silicon Motion Technology CORP | 75 | 84 | 86 | 85 | - | - | 11.8% | 8.8% | 45.9% | 11.3% | 11.1% | 25.7% | 3.7% | 0.0x | $1.8B | VS | |
$CODA Coda Octopus Group, Inc. | 74 | 83 | 90 | 79 | 16.3x | 11.9x | 7.6% | 7.0% | 66.5% | 17.1% | 15.6% | 39.0% | 0.0% | 0.0x | $115M | VS | |
$GSK GSK plc | 74 | 84 | 90 | 70 | - | - | 22.6% | 4.9% | 71.2% | 12.8% | 9.4% | 1.7% | 5.9% | 124.0x | $72.1B | VS | |
$EFXT Enerflex Ltd. | 74 | 80 | 91 | 83 | - | - | 3.0% | 1.1% | 20.9% | 7.3% | 1.3% | 3.0% | 0.9% | 67.0x | $1.2B | VS | |
$BUD Anheuser-Busch InBev SA/NV | 74 | 84 | 97 | 63 | - | - | 8.2% | 3.5% | 55.3% | 25.9% | 12.4% | 0.7% | 1.7% | 0.0x | $87.0B | VS | |
$ASYS AMTECH SYSTEMS INC | 52 | 50 | 33 | 90 | 1163.0x | 55.2x | -57.8% | -33.2% | 31.9% | -48.1% | -50.4% | -29.1% | 0.0% | 74.0x | $133M | ||
| SECTOR BENCH | - | - | - | - | - | 22.3x | 11.5x | -2.5% | -0.1% | 42.5% | 1.3% | -0.2% | 5.9% | 0.0% | 0.2x | - | REF |
AMTECH SYSTEMS INC (ASYS) receives a "Hold" rating with a composite score of 52.2/100. It ranks #1657 out of 7,333 stocks in our coverage universe and carries a 3-star rating. Ratings are driven by a 6-factor quantitative model measuring quality, value, momentum, investment, stability, and short interest.
Sign in to join the discussion.
YOY expansion rate
Core pricing power
Operating efficiency
Bottom-line conversion
Equity capital efficiency
Asset base utilization
Financial leverage load
Direct cash return
Michael Whang
Chief Executive Officer
Labor Force
330
50
40
42
Audit Verdict: Lower quality and stability scores may indicate governance concerns.
No recent insider transactions available for ASYS
Outperforming peers — winners tend to keep winning over 3-12 months
Expensive relative to fundamentals — limited margin of safety
Average quality profile
Average volatility — neutral timing signal
Moderate investment profile
Mid-range overall rating
Get full access to institutional-quality research tools with Blank Capital Pro.
Upgrade to ProStarting at $19.99/mo
Relative valuation derived from Manufacturing sector benchmarks. Model weights: EV/EBITDA (40%), P/B (35%), P/S (25%). Re-calculated daily.
Projection based on user-defined inputs. Re-calculated daily against current market data.
Reverse DCF Framework — Mauboussin Methodology
Institutional-grade Reverse DCF analysis. This model identifies the growth hurdles embedded in current market prices. When implied growth is significantly lower than historical or projected rates, a margin of safety may exist. Re-audited daily.
No analyst ratings for ASYS.
View All RatingsMaterial decline in asset turnover efficiency detected
High margin volatility — erratic forensic earnings quality
| Factor | Global | Sector | Tilt |
|---|---|---|---|
| PROFITABILITY | 50 | 31 | +19ALPHA |
| MOMENTUM | 90 | 95 | -5NEUTRAL |
| VALUATION | 33 | 13 | +20ALPHA |
| INVESTMENT | 40 | 72 | -32DRAG |
| STABILITY | 42 | 22 | +20ALPHA |
| SHORT INT | 56 | 64 | -8DRAG |
Global = full universe. Sector = relative to industry peers. Positive tilt indicates idiosyncratic strength.
ROE proxy -57.8% (sector -2.5%)
GM 32% vs sector 43%, OM -48% vs sector 1%
Capital turnover N/A
Rev growth -29%, 11yr history
Interest coverage 110.7x
Composite assessment of profitability, capital efficiency, and financial strength. Top-tier entities demonstrate sustainable cash flow generation and elite competitive moats.
Profit generated per dollar of shareholder equity
Efficiency of asset utilization
Pricing power and cost efficiency
Core business profitability
Bottom-line profitability
The Quality factor evaluates the persistence and magnitude of realized cash flows. Companies with scores >70 exhibit superior pricing power and structural financial resilience through diverse economic regimes.
Our uncertainty rating tracks the predictability of future cash flows and potential for permanent capital loss. Moderate visibility with standard industry cyclicality.
Our model assigns AMTECH SYSTEMS INC a Hold rating, with a composite score of 52.2/100 and 3 out of 5 stars. Ranked #1657 of 7,333 stocks, ASYS presents a mixed quantitative picture — neither compelling enough to initiate new positions nor weak enough to warrant selling. Investors already holding may consider maintaining their position while monitoring for changes in the factor profile.
With a quality score of 50/100, ASYS shows adequate but unremarkable business quality. The company reports a return on equity of -57.8% (sector avg: -2.5%), gross margins of 31.9% (sector avg: 42.5%), net margins of -50.4% (sector avg: -0.2%). This suggests the company generates acceptable returns but may lack the competitive positioning or operational efficiency to stand out from peers.
With a value score of 33/100, ASYS appears somewhat expensive relative to its fundamentals. Key valuation metrics include a P/E ratio of 1163.00x, an EV/EBITDA of 55.21x, a P/B ratio of 3.16x. Investors paying a premium here are likely betting on above-average growth or margin expansion to justify current prices.
With an investment score of 40/100, ASYS exhibits moderate growth-oriented spending. Key growth metrics include revenue growth of -29.1% vs. a sector average of 5.9% and a return on assets of -33.2% (sector: -0.1%). The company appears to be balancing growth investments with capital returns, though the pace of investment may not be enough to accelerate top-line growth meaningfully.
AMTECH SYSTEMS INC (ASYS) is exhibiting exceptional momentum with a score of 90/100, placing it among the strongest trending stocks in the market. Revenue growth stands at -29.1% year-over-year, while a beta of 0.91 reflects its sensitivity to broader market moves. Stocks with momentum scores this high have historically outperformed over the following 3–12 months, suggesting ASYS may continue to benefit from strong institutional interest and positive price trends.
ASYS's stability score of 42/100 signals elevated volatility and/or leverage concerns. Key stability metrics include a beta of 0.91 and a debt-to-equity ratio of 74.00x (sector avg: 0.2x). Investors should be prepared for wider-than-average price swings and consider position sizing accordingly to manage portfolio risk.
The short interest score of 56/100 for ASYS suggests somewhat elevated bearish positioning by institutional traders. Specific risk factors include elevated leverage (D/E: 74.00x), micro-cap liquidity risk. With a $133M market cap (micro-cap), AMTECH SYSTEMS INC may experience above-average volatility. Investors should consider whether the short thesis has merit or if it creates a potential short-squeeze opportunity.
AMTECH SYSTEMS INC is a micro-cap company in the Manufacturing sector, ranked #0 of 50 in its sector (100th percentile) and #1657 of 7,333 overall (77th percentile). Key comparisons include ROE of -57.8% trailing the -2.5% sector median and operating margins of -48.1% below the 1.3% sector average. This top-quartile standing reflects exceptional competitive strength relative to Manufacturing peers.
While ASYS currently exhibits a HOLD profile, superior opportunities exist within the MANUFACTURING sector. Our model identifies several "Strong Buy" candidates with higher quality scores and more attractive valuations among direct industry competitors.
View Top Manufacturing Alpha →Quant Factor Profile
Key factor gap
Momentum (90) vs Value (33) — closing this gap could shift the rating.
EV/EBITDA 382% ABOVE SECTOR MEDIAN
ROE 2232% ABOVE SECTOR MEDIAN (FAVORABLE)
Gross Margin 25% BELOW SECTOR MEDIAN
AUDIT DATA AS OF DEC 31, 2025 (Q3 FY2025)
We rate AMTECH SYSTEMS INC (ASYS) as a Hold with a composite score of 52.2/100 at a current price of $12.27. The stock presents a mixed quantitative picture — neither compelling enough to warrant new accumulation nor weak enough to justify selling for existing holders. Our factors are split, and the overall profile suggests patience is warranted.
The rating is primarily driven by strength in momentum (90th percentile) and quality (50th percentile), which together account for the majority of the composite score. Offsetting weakness in value (33th percentile) and investment (40th percentile) tempers our overall conviction. We assign a No Moat rating (26/100), High uncertainty, and Poor capital allocation.
Key items to watch: whether strong momentum is fundamentally supported by revenue trends; the path to profitability. Any material change in these dynamics could warrant a reassessment of our rating. The moat trend is stable, which suggests the competitive landscape is stable for now.
AMTECH SYSTEMS INC holds a top-quartile position (#0 of 50) within the Manufacturing sector, based on our composite quantitative scoring across quality, value, momentum, and stability factors. The composite score of 52.2/100 places it at rank #1657 in our full 7,333-stock universe. At $133M in market capitalization, AMTECH SYSTEMS INC is a small-cap player in the Manufacturing space, which limits certain scale advantages but may allow for more agile strategic execution.
Despite positive momentum (90th percentile), revenue contraction of -29% creates a divergence between price action and fundamental trajectory. This divergence suggests either that the market is looking through near-term weakness or that technical factors are temporarily inflating the stock. Investors should assess whether the revenue decline reflects cyclical weakness or structural challenges.
The margin cascade tells an important story: gross margins of 32% (-10.6pp vs sector) narrow to operating margins of -48% (-49.4pp vs sector) and net margins of -50.4%, yielding a gross-to-net conversion rate of -158%. The significant margin erosion from gross to net suggests elevated operating expenses, high interest costs, or other structural drags that warrant monitoring.
At a current price of $12.27, AMTECH SYSTEMS INC is trading at a premium to fundamental value. Our value factor score of 33/100 reflects a composite assessment across multiple valuation metrics including price-to-earnings, price-to-book, EV/EBITDA, and price-to-sales ratios relative to both sector peers and the broader market. The premium valuation implies the market is pricing in significant future growth or quality improvements that are not yet fully reflected in current fundamentals.
The stock currently trades at a P/E of 1163.0x (a 5127% premium to the sector median of 22.3x), EV/EBITDA of 55.2x (at a premium), P/B of 3.2x, P/S of 2.2x. The above-sector P/E multiple suggests the market is pricing in superior growth or quality, which our analysis finds only partially justified by current fundamentals.
Positive momentum (90th percentile) indicates institutional accumulation and favorable technical dynamics that tend to persist in the intermediate term.
A P/E of 1163.0x leaves little room for execution misses — any earnings disappointment could trigger a sharp multiple compression.
Revenue decline of -29% signals business deterioration — declining revenues make it difficult to grow into the current valuation and often precede further negative revisions.
Thin net margins of -50.4% provide limited cushion against cost pressures, competitive pricing, or macroeconomic headwinds — even small changes in costs could swing the company to a loss.
We assign a High uncertainty rating to AMTECH SYSTEMS INC. Key risk factors include current negative profitability (net margin -50.4%), elevated valuation multiple (P/E 1163.0x) that leaves limited margin for error, the combination of leverage (74% D/E) and thin margins (-50.4% net) amplifies downside risk. The wide range of potential outcomes widens our fair value estimate and increases the possibility of permanent capital impairment. Investors considering this name should size positions accordingly and demand a meaningful margin of safety before initiating.
Specific risk factors that inform our assessment include: current negative profitability (net margin -50.4%); elevated valuation multiple (P/E 1163.0x) that leaves limited margin for error; the combination of leverage (74% D/E) and thin margins (-50.4% net) amplifies downside risk. Each of these factors independently widens the distribution of potential outcomes, and in combination they create a risk profile that demands careful position sizing. The stability factor at the 42th percentile and quality factor at the 50th percentile provide a quantitative summary of the overall risk landscape.
We identify limited risk mitigants at this time, which contributes to our high uncertainty assessment. Investors should monitor for improvement in balance sheet metrics, margin stability, and business predictability that could warrant a downgrade in our risk assessment over time.
We rate AMTECH SYSTEMS INC's capital allocation as Poor. Key concerns include low returns on equity (-57.8%), negative profitability, weak asset returns (ROA -33.2%). Exemplary capital allocators generate ROE above 20% and maintain conservative leverage — AMTECH SYSTEMS INC significantly underperforms these benchmarks, raising questions about management's ability to create shareholder value.
Investors should scrutinize management's reinvestment decisions and balance sheet trajectory before committing capital. Poor capital allocation often compounds over time: overlevered balance sheets limit strategic flexibility, while low returns on capital destroy shareholder value. We would need to see sustained improvement in profitability metrics and balance sheet discipline before considering an upgrade.
In summary, AMTECH SYSTEMS INC receives a Hold rating with a composite score of 52.2/100 (rank #1657 of 7,333). Our quantitative framework assigns a No Moat (26/100, trend: stable), High uncertainty, and Poor capital allocation. The average factor score across quality, value, momentum, stability, and investment is 51/100.
Our analysis supports a neutral stance on AMTECH SYSTEMS INC. While the quantitative profile is not weak enough to warrant selling, it lacks the multi-factor strength required for a buy recommendation. Existing holders should maintain positions and monitor for catalysts — either fundamental improvement or valuation compression — that would shift the risk-reward balance.
Analysis derived from Blank Capital Research quantitative terminal. For informational purposes only. No trade solicitation. Past performance not indicative of future results. Consult a qualified advisor.
We do not assign AMTECH SYSTEMS INC a meaningful economic moat, scoring 26/100 on our composite assessment. Current fundamentals do not demonstrate the kind of durable competitive advantages — such as superior returns on invested capital, margin superiority, or reinvestment efficiency — that would protect the company from competitive erosion over the long term. The highest-scoring pillar, financial resilience, reached only 15.3/20.
The strongest moat sources are financial resilience (15.3/20) and margin superiority (7.4/20). Interest coverage 110.7x. GM 32% vs sector 43%, OM -48% vs sector 1%. These pillars form the core of AMTECH SYSTEMS INC's competitive identity and are the primary drivers of excess returns in our framework.
Areas of relative weakness include economic value creation (0/20) and reinvestment efficiency (0/20). ROE proxy -57.8% (sector -2.5%). Improvement in these areas could meaningfully widen the moat over time, while deterioration would be an early warning of competitive erosion.
Our moat trend assessment is Stable. Multi-year ROIC and operating margin trajectories show neither meaningful improvement nor deterioration, suggesting the competitive position is steady. We expect AMTECH SYSTEMS INC's moat profile to remain largely unchanged absent a material shift in return on capital or industry dynamics.
Key profit drivers include declining revenues (-29%) that pressure the earnings outlook. The margin cascade from 32% gross to -48% operating to -50.4% net reveals the company's cost structure and reinvestment intensity. Our analysis indicates that profit quality is adequate though not exceptional, with the quality factor at the 50th percentile.
The margin profile shows gross margins of 32%, operating margins of -48%, net margins of -50.4%. Return metrics include ROE of -57.8% and ROA of -33.2%. Relative to the Manufacturing sector, gross margins are 10.6 percentage points below the sector median of 43%, and ROE of -57.8% compares to a sector median of -2.5%.
The balance sheet reflects moderate leverage with D/E of 74%, revenue growth of -29%. The sector median D/E is 0%, putting AMTECH SYSTEMS INC at higher leverage than the typical peer. Overall balance sheet health is adequate for the current business environment.
Above 50MA
37.18%
Net New Highs
+51081
Amtech Systems (NASDAQ:ASYS) reported its quarterly earnings, missing analyst expectations by $0.06 EPS with revenue of $18.97 million. The semiconductor company's stock subsequently plunged 30.6% to $11.02. Despite the earnings miss, management highlighted that AI-related products now account for roughly 35% of TPS revenue, and the company achieved its ninth consecutive quarter of positive operating cash flow and holds $22.1 million in cash with no debt.

Amtech Systems Inc. (ASYS) reported mixed Q1 2026 results, with revenue and non-GAAP EPS missing analyst estimates, causing a stock decline. Despite this, the company saw strong demand for AI-related applications, leading to a healthy book-to-bill ratio and increased backlog. Amtech also improved its gross margin and generated significant cash from operations, positioning it for potential future growth driven by AI infrastructure.
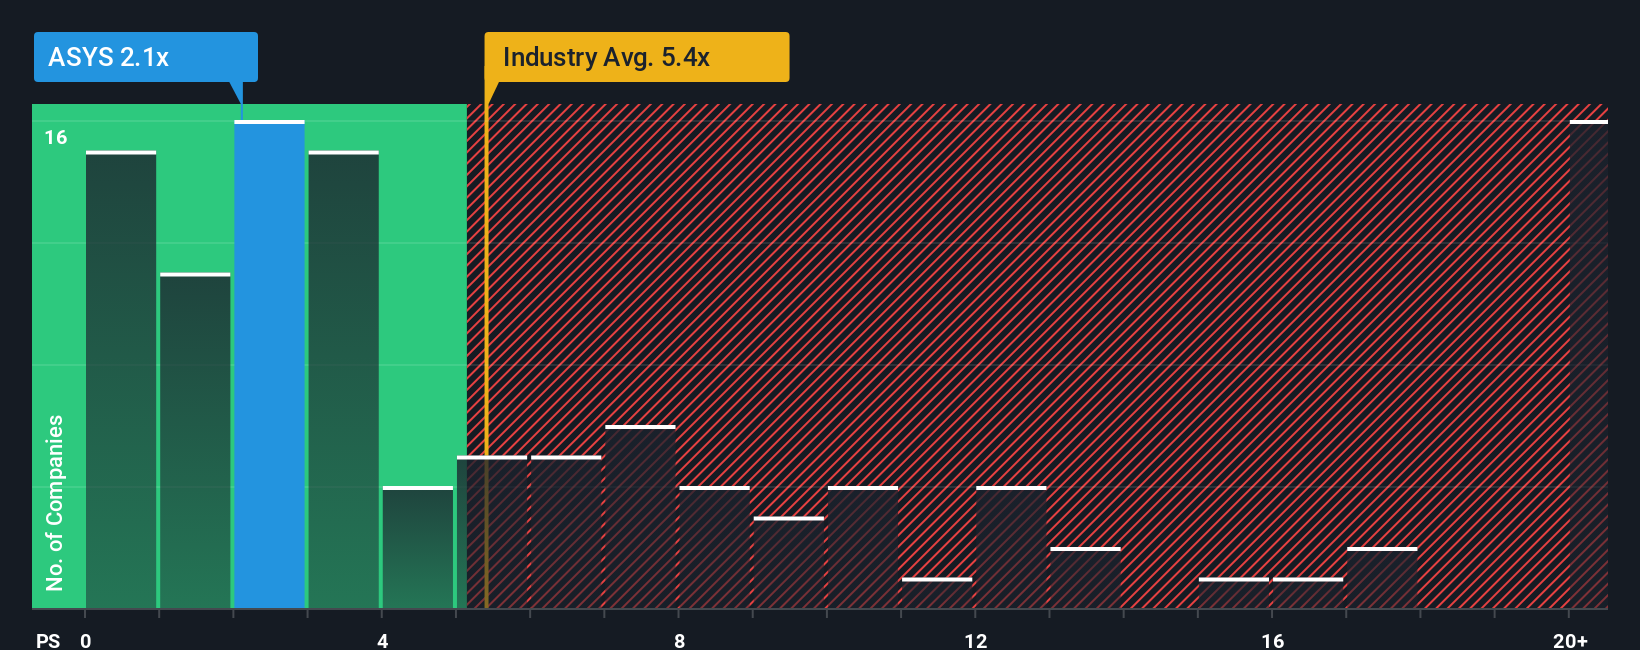
Amtech Systems, Inc. (NASDAQ:ASYS) shares have seen a significant 59% increase in the past month, adding to a 110% rise over the last year. However, despite this stock performance, the company's price-to-sales (P/S) ratio of 2.1x remains low compared to the Semiconductor industry average, signaling potential underlying business challenges. Analysts forecast a 9.6% revenue climb for Amtech Systems in the coming year, significantly lower than the projected 43% growth for the broader industry, justifying the subdued P/S ratio.

Amtech Systems (NASDAQ:ASYS) reported better-than-expected Q3 CY2025 results, driven by strong demand for semiconductor equipment in artificial intelligence infrastructure and improved operational efficiency. The company exceeded revenue and adjusted EPS estimates, crediting its flexible manufacturing model and focus on higher-margin products. Amtech anticipates continued growth from AI-driven demand and recurring revenue expansion, alongside ongoing cost optimization efforts.
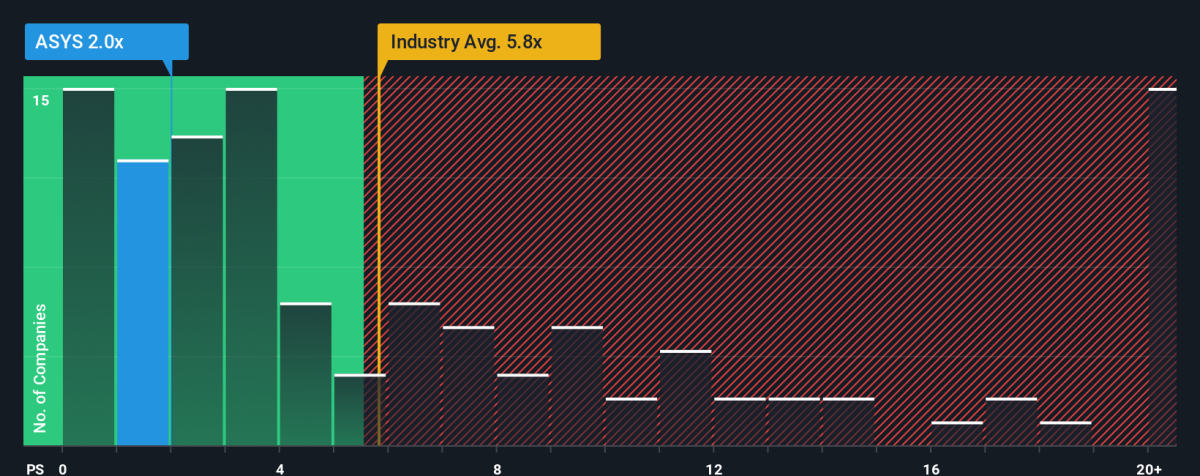
Amtech Systems, Inc. (NASDAQ:ASYS) shares have seen a 45% surge recently, and a 94% increase over the last year, yet its Price-to-Sales (P/S) ratio remains low at 2x compared to the Semiconductor industry average of 5.8x. This low P/S ratio is attributed to the company's insufficient revenue growth, which has decreased by 22% in the last year and 25% over three years, contrasting with industry-wide positive growth. Analysts forecast only 9.6% growth for Amtech Systems next year, significantly lower than the 40% industry forecast, leading investors to expect limited future growth and a reduced valuation.